Statewide Angler Diary Program 1997 - 2003
Figures 1 - 10
Figure 1. Percentage frequency distribution of the number of recorded fishing trips per season by anglers contributing to the Fishing Diary Program from 1997 to 2003 (n=number of anglers).
Figure 2. Reported fishing trips by water type for angles contributing to the Angler Fishing Diary Program (1997-2003).
Figure 3. Percentage frequency distribution of fishing trips by target species for marine/estuarine species targeted by anglers contributing to the Angler Fishing Diary Program from 1997 to 2003 (n=number of fishing trips).
Figure 4. Percentage frequency distribution of fishing trips by target species for freshwater species targeted by anglers contributing to the Angler Fishing Diary Program 1998 to 2003 (n=number of fishing trips).
Figure 5. Estimated mean total catch rate (± 2 s.e.) of snapper by anglers contributing to the Fishing Diary Program who targeted snapper in Port Phillip Bay (1997-2003).
Figure 6. Estimated mean retained catch rate (± 2 s.e.) of snapper by anglers contributing to the Fishing Diary Program who targeted snapper in Port Phillip Bay (1997-2003).
Figure 7. Estimated mean release rate (± 2 s.e.) of snapper by anglers contributing to the Fishing Diary Program who targeted snapper in Port Phillip Bay (1997-2003).
Figure 8. Estimated mean release rate (± 2 s.e.) of snapper by anglers contributing to the Fishing Diary Program who targeted King George whiting in Port Phillip Bay (1997-2003).
Figure 9. Size composition of all snapper caught (both retained and released) by anglers contributing to the Fishing Diary Program who fished in Port Phillip Bay from 1997 to 2003 (n=number of fish measured).
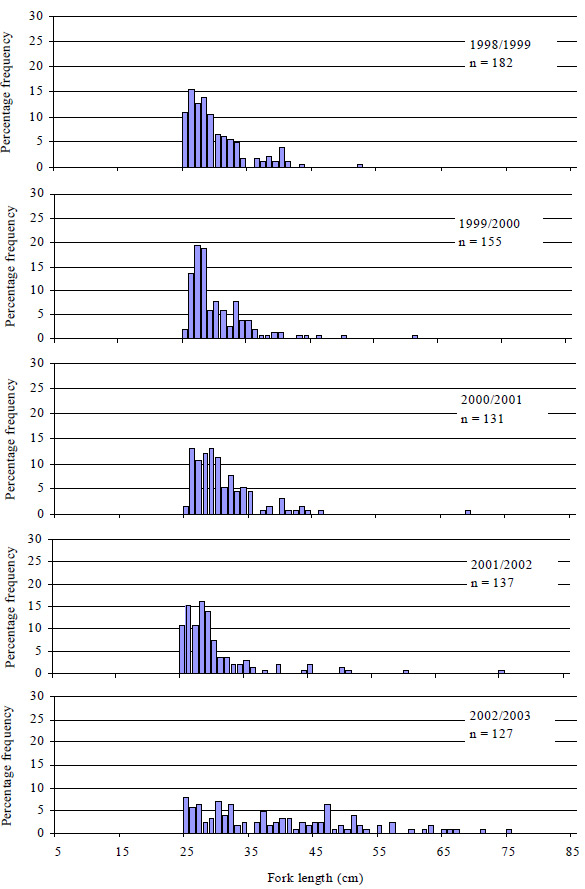
Figure 10. Size composition of snapper caught and retained by anglers contributing to the Fishing Diary Program who fished in Port Phillip Bay from 1998 to 2003 (n=number of fish measured).
Figure 1.
Percentage frequency distribution of the number of recorded fishing trips per season by anglers contributing to the Fishing Diary Program from 1997 to 2003 (n=number of anglers).
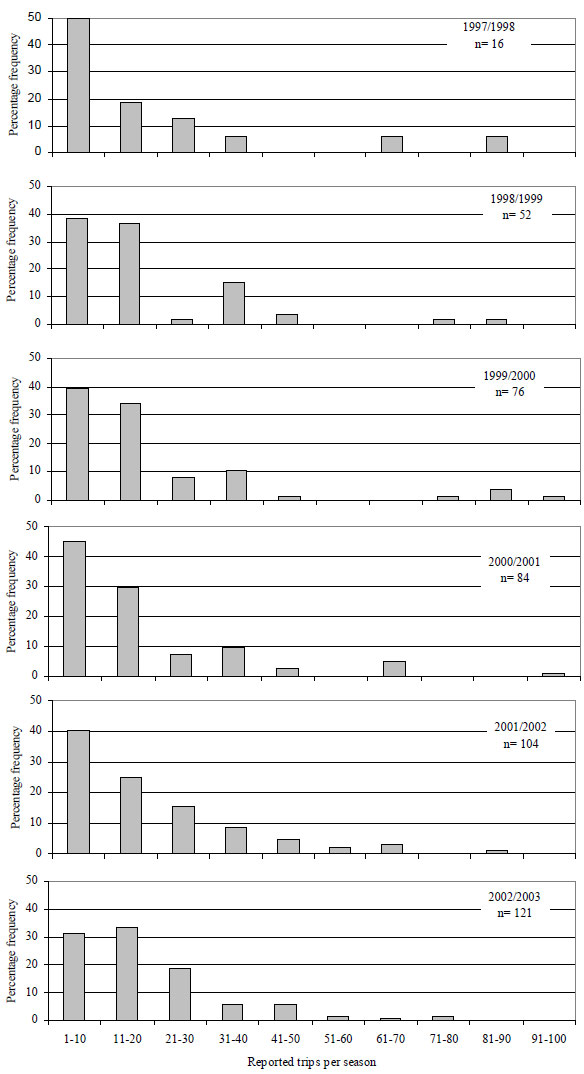
Figure 2.
Reported fishing trips by water type for angles contributing to the Angler Fishing Diary Program (1997-2003).
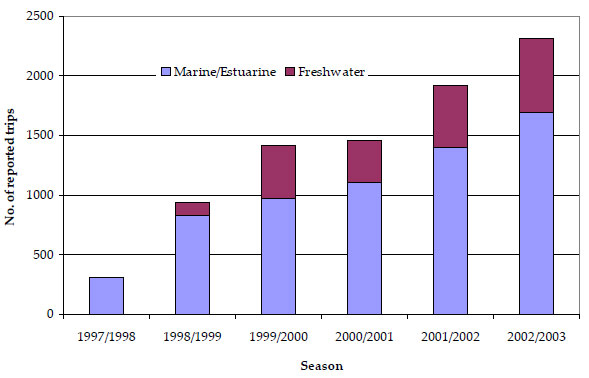
Figure 3.
Percentage frequency distribution of fishing trips by target species for marine/estuarine species targeted by anglers contributing to the Angler Fishing Diary Program from 1997 to 2003 (n=number of fishing trips).
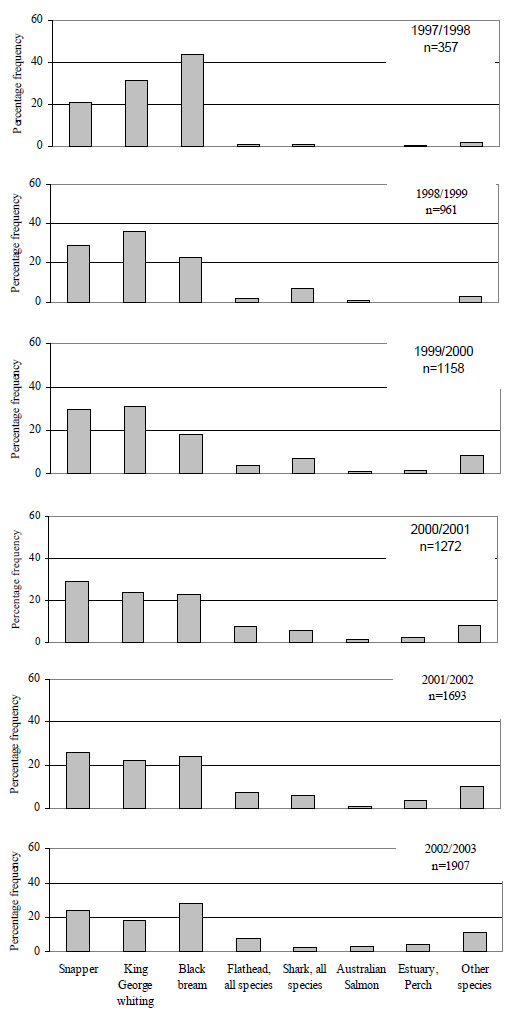
Figure 4.
Percentage frequency distribution of fishing trips by target species for freshwater species targeted by anglers contributing to the Angler Fishing Diary Program 1998 to 2003 (n=number of fishing trips).
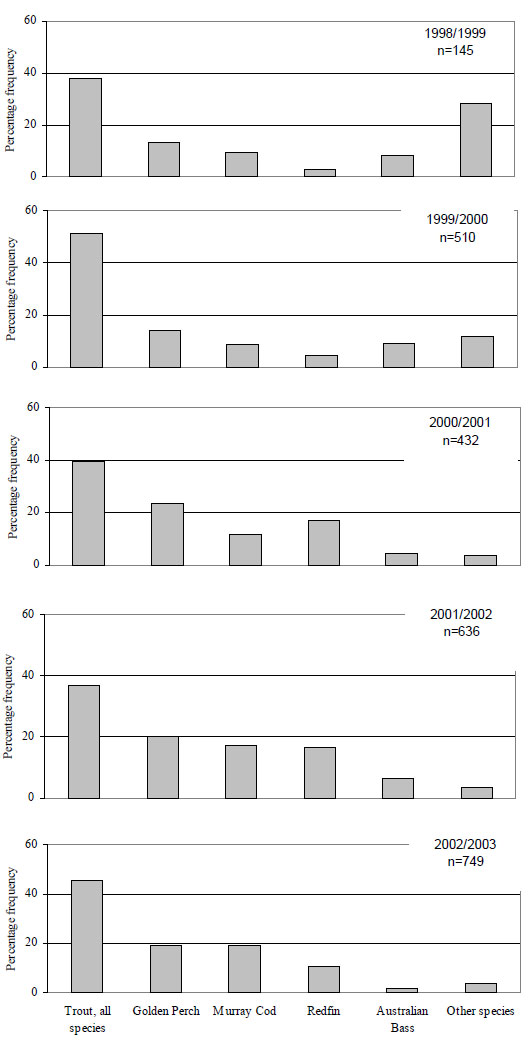
Figure 5.
Estimated mean total catch rate (± 2 s.e.) of snapper by anglers contributing to the Fishing Diary Program who targeted snapper in Port Phillip Bay (1997-2003).
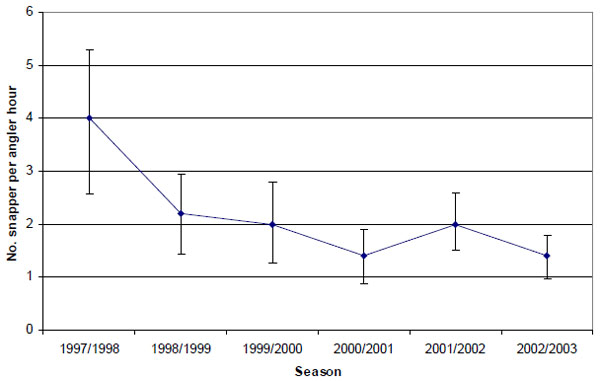
Figure 6.
Estimated mean retained catch rate (± 2 s.e.) of snapper by anglers contributing to the Fishing Diary Program who targeted snapper in Port Phillip Bay (1997-2003).
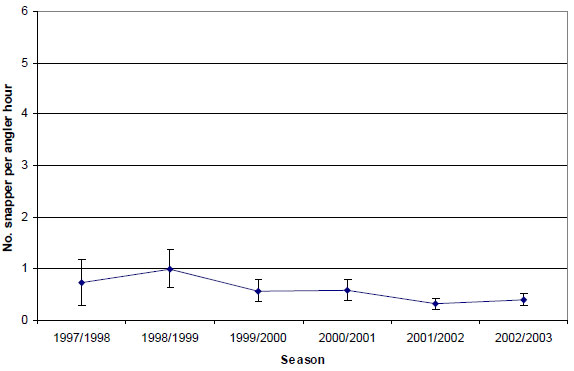
Figure 7.
Estimated mean release rate (± 2 s.e.) of snapper by anglers contributing to the Fishing Diary Program who targeted snapper in Port Phillip Bay (1997-2003).
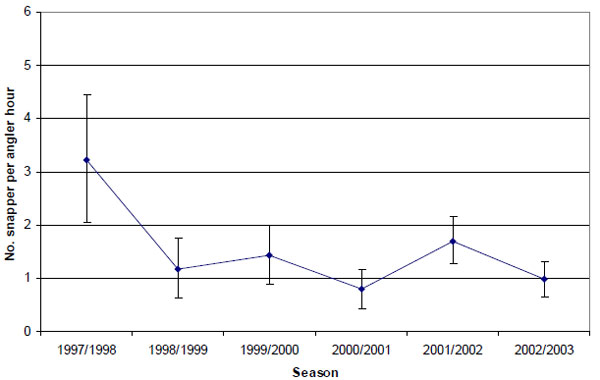
Figure 8.
Estimated mean release rate (± 2 s.e.) of snapper by anglers contributing to the Fishing Diary Program who targeted King George whiting in Port Phillip Bay (1997-2003).
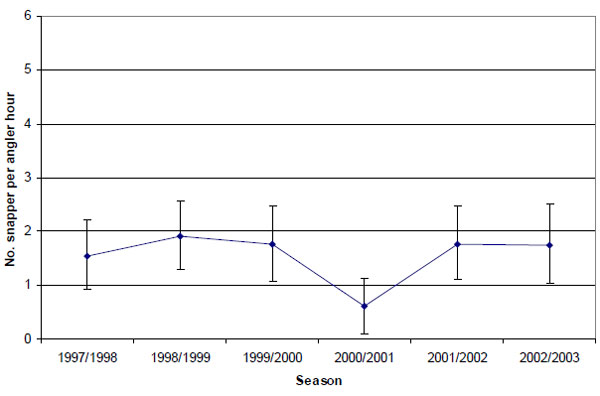
Figure 9.
Size composition of all snapper caught (both retained and released) by anglers contributing to the Fishing Diary Program who fished in Port Phillip Bay from 1997 to 2003 (n=number of fish measured).
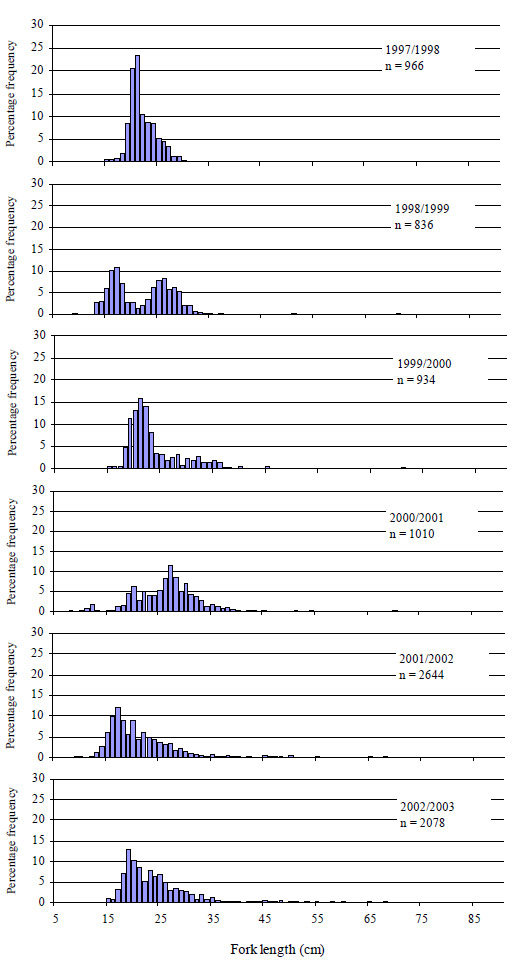
Figure 10.
Size composition of snapper caught and retained by anglers contributing to the Fishing Diary Program who fished in Port Phillip Bay from 1998 to 2003 (n=number of fish measured).
Back to Statewide Angler Diary Program 1997 - 2003 table of contents