Australian bass movement and migration in the Snowy River
![]()
Recreational Fishing Grant Program Research report
May 2009
Fisheries Revenue Allocation Committee
Paul Brown
Fisheries Victoria, Fisheries Research Branch, Snobs Creek Private Bag 20, Alexandra, VIC 3714
Table of Contents
Executive SummaryAcoustic fish tracking and remote data-logging
Australian bass movement
Adult bass and the 'sand slug'
Introduction
Methods
Acoustic listening stations and acoustic transmitting tags
Capture of bass and implanting acoustic tags
Statistical Analysis
Passage across sand reach
Results
Diurnal activity patterns
Diurnal patterns in reach-scale movement
Distances Moved and Location in the Catchment
Movement, Flow and Temperature Relationships
Passage across 'sand-slug' reach
Discussion
Movement Scale and Behaviour
Movement and Reproduction
Daily behaviour
Movement speed and detection-avoidance
Barriers to movement in the lower river
Conclusions
Acknowledgements
References
Table of Figures
Figure 1. Locations of an array of acoustic listening-stations (Vemco, VR2) deployed along the Snowy River.
Figure 2. A VR2 acoustic listening station.
Figure 3. The acoustic transmitter (V13) used to detect bass in proximity to a VR2 listening station.
Figure 4. Public information signs were displayed in several prominent locations in the SnowyRiver area to alert anglers to the potential of capturing one of the tagged fish, and if so, encourage them to return it and report the capture.
Figure 5. The listening station at Loch End detected six bass (#228, #225, #223, #220, #219 and #217) during the study. The diel distribution of these detections is shown as a frequency distribution. Hour 12=noon, 0=midnight.
Figure 6. Diel distribution of all detections for all bass by all VR2 listening stations. Data shown are average hourly frequency of detections pooled for all VR2's (upper), bars are ± 1 standard error; and total hourly frequency showing the contribution of each VR2 (lower).
Figure 7. Mean counts of Australian bass detected moving between two or more acoustic receivers during dawn (1 hour either side of sunrise), dusk (one hour either side of sunset), day (dawn to dusk) and night (dusk to dawn).
Figure 8. Movement behaviour of bass (#217) Data points represent mean river-distance from the ocean on a day when a pinger-code was detected within the range of a VR2. Curve is mean daily flow estimated from the Jarramond gauge (Theiss Hydrographic Services) January 2004-December 2005.
Figure 9. Movement behaviour of F1 hybrid (#218) originally tagged and released 84 km from ocean in March 2004. Axes as for Figure 8, p15.
Figure 10. Movement behaviour of bass (#219) Axes as for Figure 8, p15.
Figure 11. Movement behaviour of bass (#220) Axes as for Figure 8, p15.
Figure 12. Movement behaviour of putative 'bass' (#223) Axes as for Figure 8, p15.
Figure 13. Movement behaviour of bass (#225) Axes as for Figure 8, p15.
Figure 14. Movement behaviour of bass (#228) Axes as for Figure 8, p15.
Figure 15. Movement behaviour of bass (#229) Axes as for Figure 8, p15.
Figure 16. Movement behaviour of putative 'bass' (#230) Axes as for Figure 8, p15.
Figure 17. (Both panels) Data shows bass location (mean daily distance from the Ocean) for all bass tagged during the present study. The period when four bass (#217, #219, #228 and #229) andone 'putative bass' (#223) in 2004, and two bass (#220 and #225), one F1 hybrid (#218) and the same 'putative bass' (#223) in 2005, visited the lower estuary (<6km distance from ocean) after residing upstream in the freshwater reaches of the Snowy River can be broadly defined as July to early December (dashed circles). Upper panel shows bass location data overlaid on daily average temperatures at Sandy Point. Lower panel shows bass location data overlaid on daily average flows at Jarrahmond.
Table of Tables
Table 1. Identification code, and geographic position of each acoustic listening station.
Table 2. Details of bass captured and fitted with acoustic pinger tags during 2004. Genetic results are from diagnostic DNA tests (Schwartz and Beheregaray 2008). Sex determined at tagimplantation, where possible without excess duress ('?' Indicates sex undetermined).
Executive Summary
The Snowy River Rehabilitation program is a program of practical measures designed to compliment the planned increased flows to improve river health. Developed and managed by the Department of Sustainability and Environment, and the East Gippsland Catchment Management Authority, this program includes an Australian bass (Macquaria novemaculeata) study; an investigation into bass populations of the Snowy River, their habitat requirements and recruitment of young. This report details a four-year component of that Australian bass study: An investigation into migration patterns of adult bass during December 2003- December 2005. The last 12-months of this project were supported by using Recreational Fishing Licence fees.
Acoustic fish tracking and remote data-logging
To establish daily, seasonal, and annual patterns in fish movement behaviour, Australian bass were captured and surgically implanted with acoustic 'pinger' tags. Individual tag-codes allowed the presence of each fish to be logged (date and time) on strategically placed data-loggers distributed throughout the estuary and the lower 80km of the Snowy River. The majority of fish were initially captured for tagging using angling at night with lures, as this was the least stressful for the fish and the most practical method. All fish implanted with acoustic tags were also marked externally with a plastic dart-tag marked with a Vic-tag phone number. Signs were erected along the river alerting anglers to the presence of these tagged fish. During the study, no tagged fish were reported as caught by anglers. Due to the presence of hybrid 'Australian bass x estuary perch' (M. novemaculeata x M. colonorum, fin-clip tissue samples were taken and DNA analysis used to confirm each specimen's identity.
Australian bass movement
Individual bass show movement behaviours far more complex than simple models of mass spawning migration might suggest. While they may occupy temporary home-ranges for durations of weeks to months, bass move frequently and rapidly around the catchment. Some individuals were 'nomadic', making repeated transitions from estuarine to riverine habitats over at least 50 km of river.
BASS MOVEMENT AND THE RIVER ENVIRONMENT
Bass make catchment scale movements (ie. 10's of km) at all times of the year and at any time during the day in both upstream and downstream directions, sometimes within a few days. These movements may sometimes coincide with increased flows. Most of the estuarine visiting behaviour occurred during periods with a trend of rising water temperatures, while none occurred during periods of falling trend in water temperatures.
BASS MOVEMENT, AND REPRODUCTION
During each late winter and through until mid-summer, estuarine visits and periods of estuarine residence from a number of bass may indicate a phase of reproductive behaviour, although spawning behaviour could not be directly observed in tagged bass. Migration and the subsequent spawning season may extend from the end of July through to at least the end of October. Estuarine visits in the tagged bass did not consistently coincide with flow peaks. Bass were found to move extensively in all seasons and scale of movement per se was related to temperature, but not related to daily flows. The appearance of bass in the estuarine reaches also coincided with the onset of increasing daily mean water temperature after the winter minima. Bass were closer to the ocean in winter and spring than other seasons. In spring, increasing temperatures and flows were related to increasing distancefrom-the ocean. Movements of bass during winter suggested that the spawning area is within the reach broadly defined by Lochend downstream to Marlo and up the Brodribb River to the Cabbage Tree Creek.
BASS MOVEMENT: DAILY BEHAVIOUR AND SPEED OF MIGRATION
The acoustic telemetry data also provided clear evidence of a daily activity patterns in bass and their hybrids in the Snowy River. The cycle of increased detection rate observed during the hours of darkness probably indicates increased activity at a habitat-unit scale. This is likely to be due to increased foraging activity at night.
Reach-scale movements occurred at all times of the day (dusk, dawn, day night). Average speeds recorded by bass moving between reaches are quite fast at over 3 km/h. Future studies using similar technology will need to take this into account when making decisions about 'ping' interval and data-logger positioning.
Adult bass and the 'sand slug'
The study shows that the sand slug, an area of degraded sand-filled stream ~16 km in length upstream of Orbost, doesn't seem to be a barrier preventing migration and movement of adult bass. Many bass crossed upstream when flows were between 284-2062 ML/d. Some crossed multiple times up and downstream. Downstream crossing generally took from a few hours to six days, and upstream crossings from two to 10 days. Some fish spent significant amounts of time within the sand slug, indicating that it may contain at least some useable habitat.
Introduction
Australian bass (Macquaria novemaculeata) are known to be catadromous migrants (largely freshwater lifecycle returning downstream to spawn in the estuary), that travel extensively within larger catchments of rivers on the south-eastern coast of Australia. The life history of bass starts with larvae hatching in estuarine waters, where they develop until settlement occurs in beds of macrophytes at about 25-30 mm TL (Harris and Rowland 1996). As juveniles during spring-summer they migrate upstream into the catchment where they mature after two to four years for males, or five to six years for females (van der Wal 1983). Males may remain in (or near) tidal waters while females travel further upstream and the population is thus sexually-segregated outside the breeding season (Harris and Rowland 1996). On maturity, the adults return downstream to spawn. Although decreasing day-lengths and temperatures are thought to synchronise gonadal development, high river flows are thought to be important triggers for downstream migration and spawning (Harris 1986). Strong recruitment and subsequent year-class strength were also correlated to flooding during spawning months in NSW (Harris 1985).
The timing of downstream spawning migration is variable depending on location, but in central NSW, after fish mature February-May, spawning usually occurs June-September at temperatures ranging from 11-16oC (Harris 1986; van der Wal 1983). Observations in Victorian waters indicate either greater uncertainty, or more temporal variability, and downstream spawning migrations are said to occur June- December (McCarraher 1986). The return movements of adults into freshwater after spawning may take several months in NSW, during August-October (van der Wal 1983). The high degree of uncertainty about the scale, timing, and trigger mechanisms of bass movements in Victoria hinders the overall understanding of the life-history requirements of the species. This study aims to increase this understanding and thus aid efforts to rehabilitate coastal river habitats for the species through catchment and flow-management. Acoustic telemetry is increasingly being used in marine, and estuarine environments to monitor fish movement behaviours (Lucas and Baras 2000). Arrays of remote listening and data-logging devices are deployed to record data from individually coded acoustic 'pinger' tags that can be implanted in fish. Acoustic listening stations are smaller, more self-contained, easier to use and cheaper than similar radio-receiving technology.
Methods
In January-March 2004 a total of 13 'putative bass' were caught, fitted with individually coded acoustic tags, and released at their capture location. Fin clips, as tissue samples, were taken from all but 4 fish to confirm their species identity using genetic testing. Four out of six fish from Jackson's
Crossing were unable to be genetically tested due to a failure in preservative supplies. Bass that were tagged represent a range in size (494g- 2193g), gender and location from Orbost up to Jackson's Crossing. Upstream and downstream movement was recorded as the tagged bass passed within range of the
listening stations during the two years between tagging and the final data-download in December 2005.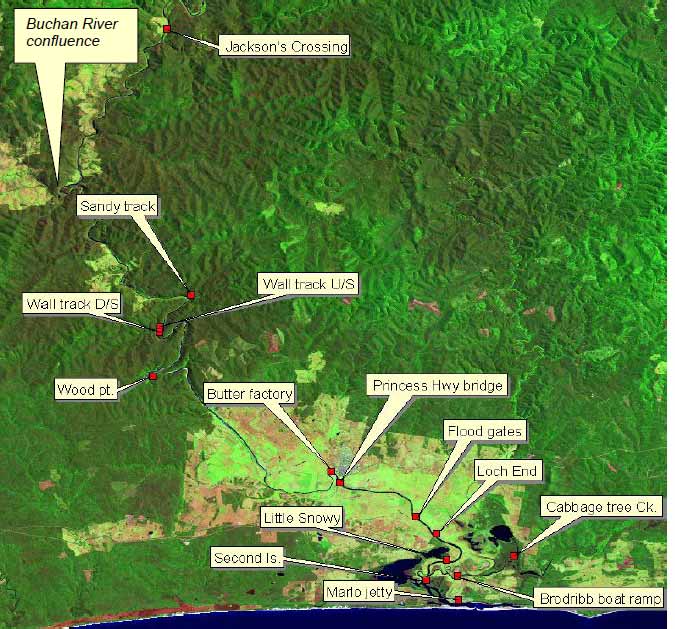
Figure 1. Locations of an array of acoustic listening-stations (Vemco, VR2) deployed along the Snowy River.
In December 2003 and January 2004, a total of 14 acoustic listening stations (VEMCO, VR2 units) were deployed in the Snowy River and estuary, from Marlo upstream to Jackson's Crossing (Figure 1 & Table 1).
Table 1. Identification code, and geographic position of each acoustic listening station.
| VR2 | Location | River-distance from Ocean (km) | Latitude | Longitude |
|---|---|---|---|---|
| 3287 | Snowy River Marlo Jetty | 1.3 | -37.798100 | 148.534745 |
| 3288 | Snowy River u/s Second Island | 4.1 | -37.784517 | 148.512539 |
| 3293 | Snowy River u/s Little Snowy | 6.6 | -37.770321 | 148.526322 |
| 3289 | Brodribb River boat ramp | 8.5 | -37.781250 | 148.534167 |
| 3292 | Snowy River Lochend | 10.1 | -37.752417 | 148.519283 |
| 3291 | Snowy River floodgates | 12.0 | -37.740300 | 148.505367 |
| 3290 | Brodribb River below Cabbage tree Ck | 12.8 | -37.767327 | 148.573450 |
| 3294 | Snowy River Princess Highway bridge | 18.1 | -37.716940 | 148.452585 |
| 3285 | Snowy River u/s Butter factory | 19.6 | -37.709717 | 148.446750 |
| 3283 | Snowy River Wood Point | 37.8 | -37.643833 | 148.323333 |
| 3282 | Snowy River d/s Wall Track | 46.5 | -37.613784 | 148.328069 |
| 3295 | Snowy River u/s Wall Track | 47.0 | -37.610139 | 148.328542 |
| 3286 | Snowy River Sandy Point | 50.1 | -37.588017 | 148.350017 |
| 3284 | Snowy River d/s Jackson's Crossing | 84.0 | -37.404408 | 148.333596 |
Each VR2 (Figure 2.) was capable of receiving an acoustic signal from a transmitter passing within a distance equivalent to (and often exceeding) the width of the river; therefore, any transmitters passing a VR2 were potentially detectable. VR2s were deployed by suspending them in the river and chaining them to an immoveable object (e.g. tree trunk). To ensure constant submersion during potentially fluctuating water levels in the freshwater reaches, VR2s were mainly deployed in deep pools where bank access was assured for servicing by field-staff. On detecting a coded-transmission, the on-board processor decodes the signal and records the time and date of the transmission along with the identifying code for that tag (fish). Data is stored in flash-memory and field staff periodically download the stored data to a Personal Computer.
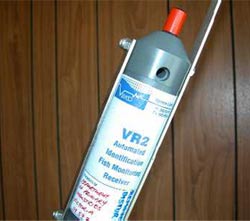
Image of a VR2 acoustic listening station.
The transmitters used, VEMCO model V13, are 'coded pingers' that send acoustic pulse trains containing an ID number which permits identification of the specific tag (Figure 3). V13 pingers are 13mm x 36 mm in size and weigh 6g in water. Battery life was anticipated as >900 days. The coded pingers transmitted at 69.0 kHz with a random delay of between 60 and 180 seconds. This randomisation allowed multiple pingers to be received and decoded clearly by a single VR2 without code-collisions masking each other. Software (VR2PC, VEMCO) scans all the data files for any given coded-pinger and builds a list-file of the times and dates where that coded pinger was encountered by any VR2. This file is the basis for subsequent analyses of movement rates etc.
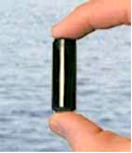
Figure 3. The acoustic transmitter (V13) used to detect bass in proximity to a VR2 listening station.
Capture of bass and implanting acoustic tags
Based on the weight of the tags and applying the "rule-of-thumb" that tags should represent ~2% of the fish body-weight, bass >300g were required (Winter 1983). Bass were captured with the method that was least stressful and caused the least physical damage to the fish. Therefore, angling (with lures) was preferred and was tried first at each location. Electrofishing was also a preferred method and although effective, it was limited to the few locations where electrofishing boat access was possible. If bass could not be obtained using angling or electrofishing, then gillnets were used. Gillnets were set for one hour either side of dusk and constantly attended to ensure that bass (and any by-catch) were removed as soon as possible after capture.
On capture, fish were anaesthetised using benzocaine (0.1 g l-1) until opercular movements became slow and irregular. Each fish was weighed and measured (fork length). Sex was sometimes determined via inspection during the surgical procedure, but this was not always possible. The transmitters were implanted surgically via a 2.5 cm incision on the ventral side of the fish just above the mid-line. The transmitters were inserted into the abdominal cavity. The incision was closed by sutures and sealed with a cyanoacrylate-based adhesive. Total surgery time averaged two to three minutes. Fish were kept moist during surgery with water sprayed via an atomiser over the gills and body, where necessary. Most surgery was done immediately, or within one to two hours of capture; occasionally fish were held in the river in an enclosure overnight before surgery.
After surgery, anaesthetised fish were also tagged with a numbered plastic dart tag into the dorsal musculature to enable external identification in case of capture by an angler. When possible, a tissue sample (fin clip) was also taken to confirm species identification by DNA testing (Schwartz and Beheregaray 2008). Tagged bass were allowed to recover from anaesthesia (<10 minutes) before release at the capture-site.
ACOUSTIC CODED PINGER-TAGGED BASS
Thirteen bass were implanted with acoustic Sandy Point (n=3) and Jackson's Crossing coded pingers and released in four locations; (n=6) (see Figure 1 for locations and Table 2 Orbost Butter Factory (n=2), Wall Track (n=2), for fish details).
Table 2. Details of bass captured and fitted with acoustic pinger tags during 2004. Geneticresults are from diagnostic DNA tests (Schwartz and Beheregaray 2008). Sex determined at tagimplantation, where possible without excess duress ('?' Indicates sex undetermined).
| Date (2004) | Capture/release location | Length | Weight | Sex | Vemco code | Genetic Identification |
|---|---|---|---|---|---|---|
| 22 Jan | Wall Track | 470 | 1870 | ? | 219 | Australian bass |
| 22 Jan | Orbost Butter Factory | 460 | 1695 | F | 217 | Australian bass |
| 22 Jan | Orbost Butter Factory | 430 | 1380 | F | 220 | Australian bass |
| 17 Feb | Wall Track | 418 | 1296 | ? | 221 | Australian bass |
| 18 Feb | Sandy point | 408 | 1157 | ? | 225 | Australian bass |
| 19 Feb | Sandy point | 275 | 377 | ? | 229 | Australian bass |
| 19 Feb | Sandy point | 442 | 1626 | F | 228 | Australian bass |
| 25 Feb | Jackson's Crossing | 367 | 812 | ? | 216 | N/a |
| 25 Feb | Jackson's Crossing | 300 | 494 | M | 224 | N/a |
| 25 Feb | Jackson's Crossing | 485 | 2193 | ? | 223 | N/a |
| 26 Feb | Jackson's Crossing | 310 | 574 | M | 230 | N/a |
| 11 Mar | Jackson's Crossing | 360 | 834 | M | 227 | F1 bass x perch hybrid |
| 11 Mar | Jackson's Crossing | 403 | 1480 | ? | 218 | F1 bass x perch hybrid |
Statistical Analysis
Diurnal activity detection
Patterns in detection frequency throughout the day were examined by accumulating detection frequencies for each hour (00:00h - 23:00h). The number of detections was counted for each hour, fish and VR2. Total hourly detection frequencies were plotted for all fish to look for diurnal changes in detection frequency that might indicate behavioural trends. High detection frequencies might occur in response to an inactive, slow-speed fish if the tag is occasionally within detection range for long periods or by an active, high-speed fish where the tag is often within detection range for short periods.
Analysis of diurnal patterns
Detection data was categorised by labelling detections as occurring during four time-periods of the day -"dawn", "day", "dusk" and "night." As the timing of sunset and sunrise varies throughout the year, these periods were defined for each month according to the following rules:
- Dawn = one hour before sunrise to one hour after sunrise;
- Dusk = one hour before sunset to one hour after sunset;
- Day = period between dawn and dusk; and
- Night = period between dusk and dawn.
Australian Eastern Standard Time(Universal Standard Time +10 h) was used throughout.
Times for sunrise and sunset each day were approximated by calculating sunrise and sunset time for the 15th day of each month using an online day-length and photoperiod calculator for latitude 37°S and longitude 150°E.
Analysis of Location, Movement, Flow and Temperature
Daily flow data (MLday-1) was measured by Theiss Hydrographic Services at the Jarrahmond gauge (22 January 2004-11 December 2005). Average daily water temperature (°C) was calculated from temperatures recorded hourly on a data-logger (Stowaway-TidBit, Onset Computer Corporation Inc.) in the Snowy River at Sandy Point.
Fish detections on all listening stations were converted to fish locations with reference to average river-distance from the ocean (location) (km) using the known locations of the listening stations (Table 1). The data set was expanded using the assumption that on days when a fish was not located, it remained at its last known location. Daily fish movements were calculated from detections as the absolute (upstream or downstream) distance moved (km) since the last known location.
Fish movement, location and flow data were log-normally distributed as variables, and were log-transformed to satisfy assumptions of normality before subsequent analyses. Location and movements were classified by season, as summer (December through February), autumn (March through May), winter (June through August) or spring (September through November).
ANOVA using SAS GLM procedure was used to test the null hypotheses that bass movements and location do not depend on season, flow and temperature. This was followed with pair-wise comparison of means using least squares means. The variables 'season' (n=4) and 'fish' (n=7) were used as classification variables in the model while continuous variables for 'flow' and 'temperature' were used as covariates. The parameter estimates option (SAS GLM Model/Solution) identified the sources of variation that were significant and the coefficients of the linear regression quantifying the relationship between bass movement, location and temperature and flow variables.
Rate of movement
Individual maximum movement rates (speed) were estimated from distance moved between listening stations and the duration of movement. Duration was calculated as arrival time (at the second VR2) minus departure time (from the first VR2). The synchronisation of clocks on board the various VR2s 'drifted' by several minutes throughout the study and this causes timing anomalies in speed calculations over short distances and times. A few minutes 'error' is of no concern to most of the data analyses in this study, but proved troublesome when considering speed calculations. To solve this problem only distances between VR2s >5 km apart were considered when estimating speed of travel. This minimises the proportional effect of a few minutes error. Speed was calculated in kilometres per hour (km/h) and also, to assist with comparisons in the literature, converted to the more biologically meaningful scale of 'bodylengths per second' (bl/s) using the known fish size at tag implantation.
Reach-scale movement
Diurnal patterns in large-scale movement between reaches were analysed by counting the number of times each tagged fish was detected on two or more acoustic listening stations during dawn, day, dusk and night periods. Analysis of variance (SAS GLM) was used to statistically determine if bass had moved between reaches more during some periods of the day than others. These periods are not the same duration; day and night are long compared with short two hour periods of dusk and dawn. So that counts could be compared, the average duration of each period (Dawn=2 h, Day=9.98 h, Dusk=2 h, Night=10.03 h) was used to standardise the counts. Counts for each period were divided by the average duration of that period to give average movements per hour.
Passage across sand reach
The 'sand slug' is approximately 16 km of relatively featureless, sand-filled river channel, where summer flow levels result in a shallow (< 50cm), braided, open channel. Although the boundaries of this feature are hard to determine precisely, it predominantly lies upstream from Orbost, to where the Snowy flows out of the hills at the northern boundary of the coastal floodplain. Hence the acoustic listening stations at Woods Point and the Butter Factory are situated close to the upstream and downstream boundaries of the sand slug, respectively. The sand slug reach is viewed by many to be a potential bottleneck for migrating fish. This is possibly more an issue for small species or young/small individuals, but nevertheless remains a possible hindrance for adult bass returning to estuarine waters to spawn and also re-accessing the upper catchment after spawning is completed. Observation of any movements of coded pinger-tagged bass across this sand slug will, therefore, be of relevance to Snowy River restoration objectives.
Results
From the seven bass, four 'putative bass', and two bass x perch hybrids that were implanted with coded-pingers, a total of 63,078 detections by the acoustic listening-stations (VR2s) were recorded to 11 December 2005.
Some fish spent long periods of time within range of VR2s and recorded 1000's of hits; others (e.g. #218) recorded only three hits, nevertheless providing useful information as to the fish's movement since tagging. Single hits were excluded if there was no other supporting evidence. Only two fish were tagged and released without being subsequently detected on any VR2 (#216 & #224). The ultimate fate of these fish is unknown. None were reported as captured by anglers despite external tags identifying each acoustic-tagged fish and information-signs displayed at prominent locations (Figure 4). Fish that stopped 'transmitting' data to acoustic listening stations during the study before the scheduled tag-battery expiry date (e.g. #217, #219 , #229), may have done so because they left the study area, died through natural or angling-related mortality, or shed the tag out of detection range.
Data from the acoustic tags show a range of fish behaviours, including home-range behaviour and movements by some individuals, of several kilometres. Some fish moved past, or were recorded on several VR2s in succession, indicating their progression up and downstream. It is also evident that some individuals were able to pass by a VR2 undetected, as there are instances of fish 'skipping' several listening-stations and then appearing again elsewhere. This is unfortunate, but does not preclude the usefulness of the data set.
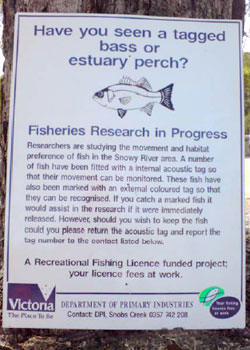
Figure 4. Public information signs were displayed in several prominent locations in the SnowyRiver area to alert anglers to the potential of capturing one of the tagged fish, and if so,encourage them to return it and report the capture.
Diurnal activity patterns
The frequency of detections of tagged bass, plotted as a frequency for each fish at a given by most of the VR2s, increases during the VR2, diurnal patterns can be observed hours of darkness although behaviour of (Figure 5).
Figure 5. The listening station at Loch End detected six bass (#228, #225, #223, #220, #219 and#217) during the study. The diel distribution of these detections is shown as a frequency distribution. Hour 12=noon, 0=midnight.
Although occasional individuals were detected during the daylight period, a diurnal rhythm was observable at most VR2s. Pooling the detection frequency data for all bass detected at all VR2s, reinforces this overall diurnal rhythm (Figure 6). The overall pattern is that frequency of detection is minimal during 09:00-17:00 hrs and increases around dusk to a peak after midnight, before declining to daytime levels after dawn. This pattern is stronger for some acoustic listening stations than others and may be dependant on the type of habitat that the device is deployed in (Figure 6, lower). The diurnal pattern was more pronounced for devices located in pools, where we were also successful in collecting bass using angling methods at night (e.g. Sandy Point, Wall Creek, Orbost Butter Factory, Orbost Bridge and Jacksons Crossing) suggesting that the tagged fish were spending a high proportion of their time during the night at these locations and that these pools are preferred nocturnal habitat for bass.
Figure 6. Diel distribution of all detections for all bass by all VR2 listening stations. Data shown are average hourly frequency of detections pooled for all VR2's (upper), bars are ± 1 standard error; and total hourly frequency showing the contribution of each VR2 (lower).
Rate of movement
Seven bass were observed making movements >5 km between adjacent VR2s (n=41). Speed was estimated from these fish in both upstream (n=28) and downstream (n=13) directions.
Bass moved upstream at speeds of up to 9.8 km/h (5.6 bl/s); and moved downstream at speeds of up to 1.9 km/h (1.2 bl/s). Average upstream movement (3.43 km/h, 2.18 bl/s) was significantly faster than average downstream movement (0.73 km/h, 0.45 bl/s) (t=1.69, p < 0.001).
Diurnal patterns in reach-scale movement
When the tagged bass moved between reaches, they were just as likely to do so by night or by day. For the seven bass detected moving between receivers on a given date, there were significant differences in the mean frequency of movements among those that were detected during dawn, day, dusk and night
(F=12.21, p < 0.0001). Few movements occurred around dawn or dusk and pairwise testing of means (SNK-test, p < 0.05) showed that these periods overall had fewer movements than the longer night and day periods. Although the mean count of reach-scale movements that occurred at night was slightly higher than during the day, this difference was not significant (Figure 7).
Figure 7. Mean counts of Australian bass detected moving between two or more acoustic receivers during dawn (1 hour either side of sunrise), dusk (one hour either side of sunset), day (dawn to dusk) and night (dusk to dawn).
When these data are standaII rdised to account for the differences in duration of each period, there was no difference in bass reach-scale movements per hour between dusk/dawn periods, and night/day periods. There were no significant differences in the mean frequency of movement among those that were detected during dawn, day, dusk and night (F=1.86, p=0.16).
Distances Moved and Location in the Catchment
The location of tagged bass in the lower 80 km of the catchment is shown in time-series (Figure 8-Figure 16) for almost two years. These plots also convey the distance and direction moved by fish that were caught and tagged in freshwater, and where there is some re-encounter data recorded by VR2 listening stations. Genetic testing (Schwartz and Beheregaray 2008) has shown that the data are from six bass (Figure 8, Figure 10, Figure 11, Figure 13, Figure 14 and Figure 15) , one F1-hybrid (Figure 9), and two were untested and classed as 'putative' bass (Figure 12 and Figure 16).
The greatest downstream movements recorded were of ~83 km by fish #223, a 2.2 kg 'putative bass', from Jackson's Crossing down to Marlo Jetty (Figure 12), and fish #218 (1.5 kg, F1-hybrid) again from Jackson's Crossing down to the Little Snowy River near Marlo (Figure 9).
Large upstream movements were also observed, such as those of fish #228, a 1.6 kg female bass tagged at Sandy Point some 50 km from the ocean. This individual made repeated visits to the lower catchment in the Brodribb River at the mouth of Cabbage Tree Creek, and the Marlo area in the Snowy River, returning at least four times to the Sandy Point vicinity (Figure 14). Bass #220, and #217 tagged at Orbost in January, both moved upstream ~30 km to the Wall Track /Sandy Point area in May 2004 (Figure 8 & Figure 11).
Several fish also showed long periods of residence in a single location. Bass #219, #220 and 'putative bass' #230 remained in almost daily contact with a single VR2 for months at a time close to the location where each fish was originally captured and tagged. While #219 and #220 also eventually made
catchment-scale movements, #230 was resident near the Jackson's Crossing VR2 during the entire study. It appears that this 'residence' behaviour occurs independent to distance from sea (ie. near, medium and far from sea).
Figure 8. Movement behaviour of bass (#217) Data points represent mean river-distance from the ocean on a day when a pinger-code was detected within the range of a VR2. Curve is mean dailyflow estimated from the Jarramond gauge (Theiss Hydrographic Services) January 2004-December 2005.
Figure 9. Movement behaviour of F1 hybrid (#218) originally tagged and released 84 km from ocean in March 2004. Axes as for Figure 8, p14.
Figure 10. Movement behaviour of bass (#219) Axes as for Figure 8, p14.
Figure 11. Movement behaviour of bass (#220) Axes as for Figure 8, p14
Figure 13. Movement behaviour of bass (#225) Axes as for Figure 8, p14
Figure 14. Movement behaviour of bass (#228) Axes as for Figure 8, p14
Figure 15. Movement behaviour of bass (#229) Axes as for Figure 8, p14
Figure 16. Movement behaviour of putative 'bass' (#230) Axes as for Figure 8, p14
Movement, Flow and Temperature Relationships
River Flows
Flows measured at Jarrahmond ranged from 113 ML/d (13 March 2004) to 19 300 ML/d (22 March 2004). There were twelve significant flow events during the study period, the first six peaking at less than 4000 ML/d on 13 May, 19 July, 11 September, 15 November and 17 December in 2004, and 5 February 2005. The next six were larger and peaked on 11 July (maximum during study 19 300 ML/d); 6 August, 13 September, 1 October, 5 November, and 3 December 2005. River temperature varied seasonally with average daily temperatures of 6.0°C (19 July 2004) to 26.2°C (28 January 2005).
Bass Movement
Bass moved similar distances in all seasons. General linear modelling showed that, taking into account individual variation among fish along with flow and temperature variation, the null hypothesis that bass movement was similar in each season was accepted (F=0.65, p=0.58). When season was dropped from the model, a significant proportion of the variation in fish movement was explained by temperature (F=8.34,p=0.004), but not by flow (F=0.83, p=0.37).
A linear regression of fish movement on temperature is significant (F=10.15, p=0.0017) and shows that temperature is inversely related to fish movement in the relationship in Equation 1, (i.e. bass move greater distances in colder stream temperatures).
FishMovement = 2.44 - (0.075 x Temperature)
Equation 1. Where FishMovement is the natural Log of absolute movement (km) of bass since last known location, and Temperature (°C) is mean daily water temperature in the Snowy River at Sandy Point.
Bass Location
Bass were significantly lower in the catchment in winter and spring, than in summer and autumn (p <0.001). General linear modelling showed that, taking into account individual variation among fish along with flow and temperature variation, the null hypothesis that bass location was similar in each season was rejected (F=17.01, p<0.001). The interactions between temperature and season (F=32.02, p<0.001), and flow and season (F=9.64, p<0.001), were significant.
Seasonal regression models of temperature and flow explained a significant proportion of the variation in bass location for spring, summer and winter, but not for autumn. In spring (n=1103), temperature (F=20.3, p<0.001) and flow (F=6.4, p=0.012) are positively related to bass location in the catchment. In summer (n=803), flow (F=22.6, p<0.001) but not temperature, was positively related to bass location in the catchment. In winter (n=1350), temperature (F=16.8, p<0.001) and flow (F=19.9,p<0.001) were inversely related to bass location in the catchment.
SpringFishLocation = 0.424 + 0.424 + (0.056 × Temperature) + (0.247 × Flow)
Equation 2. Where SpringFishLocation is the natural Log of daily average distance from the ocean (km) of bass, Temperature (°C) is mean daily water temperature in the Snowy River at Sandy Point, and Flow is the mean daily discharge at the Jarrahmond gauge (ML/d) during September, October and November.
SummerFishLocation = 5.029 − (0.022 x Flow)
Equation 3. Where SummerFishLocation is the natural Log of daily average distance from theocean (km) of bass, and Flow is the mean daily discharge at the Jarrahmond gauge (ML/d)during December, January and February.
WinterFishLocation = 5.470 − (0.102 x Temperature ) − (0.197 x Flow)
Equation 4. Where WinterFishLocation is the natural Log of daily average distance from theocean (km) of bass, and Temperature (°C) is mean daily water temperature in the Snowy Riverat Sandy Point., and Flow is the mean daily discharge at the Jarrahmond gauge (ML/d) during June, July and August.
The overall pattern for flow and movement is not consistent. Two out of nine fish with data records undertook significant catchment-scale movements, seemingly in response to the first flow event on 13 May. The flow increase in May (~2000 ML/d) of around one week duration, coincided with fish #217 moving 30 km upstream and then 40 km downstream (Figure 8). Fish #220 also moved 30 km upstream on this flow, and may have remained upstream between Sandy Point and Jackson's Crossing (Figure 11). The peak of the same flow event prompted the reappearance of fish #219 that moved back downstream to the Wall Track area after over a month's absence (Figure 10). Fish #218 must have moved down to the estuary from Jackson's crossing before the influence of this flood peak was felt (Figure 9). Fish #230 did not seem to move from Jackson's Crossing in response to this, or any subsequent flow-peak (Figure 16). However, a substantial proportion of this first flow event entered the Snowy River from the Buchan River. The Buchan River is downstream of Jackson's Crossing, and fish #230. Whether the second and third flow events also had their origins in the Buchan River is unknown.
A second larger and more sustained flow event peaked on 19 July. Fish #223 and #225 both were re-detected again, coincident with this second (July) flow peak, after a period of absence (Figure 12 & Figure 13). However, this is the only evidence of any movement-response from any of the tagged fish coincident with this flow event.
The third substantial flow peak, in September, again produced little obvious movement behaviour in the tagged fish; although it may have prompted fish #228 to return to the estuary (Figure 14).
Flow peaks in 2005 started in July and were approximately monthly in frequency until December. The first peak preceded the reappearance of F1-hybrid #218, and coincided with the re-appearance of putative bass #223 having moved down from Jackson's Crossing. Bass #220, #225 and #228 apparently remained in the Sandy Point area throughout the initial flow peaks, and visited the estuary coincident with later peaks in September, and November.
Eight fish (see Figure 17 for details) were observed making a 'classic' downstream migration in the late winter/spring. Bass #219, made a brief visit to Marlo Jetty in late August and a second one down to Orbost before returning to the Wall Track area each time (Figure 10). Bass #220 didn't visit the estuary the first year after tagging but came downstream in September and November 2005 (Figure 11). Putative 'bass' #223, originally tagged at Jackson's Crossing remained unobserved until it was detected at Marlo in late July and early August, after which it returned to Jackson's Crossing only to revisit the estuary again in July 2005, possibly following a flow peak. Bass #225 largely remained in the location it was tagged at Sandy Point throughout 2004, and through the first four flow peaks of 2005 when it made a visit to the estuary coincident with the fifth flow peak in November 2005, and then returned upstream.
Bass #229 was tagged and spent most of the project near Sandy Point (Figure 15). In mid-August it swam downstream and was observed at several VR2s in the estuary (e.g. Little Snowy River, Second Island, Brodribb boat ramp, Brodribb at Cabbage Tree Creek and Marlo Jetty), until mid-September.
Similar, but less definitive observations can also be made about several other fish. Fish #230, was not seen for several months after tagging at Jackson's Crossing in February, until it turned up briefly at Marlo Jetty at the end of July, and again in early August (Figure 16). This fish was not recorded in 2005.
Bass #228 made several visits to the lower estuary from the Sandy Point area between the end of July and early October, November and December (Figure 14). In late December, it returned up the catchment to the Sandy Point area where it remained through four to five flow peaks and did not revisit the
estuary until the following November on the sixth flow peak of 2005. Such movements may be associated with spawning behaviour, but the timing of the pattern is variable between fish. Individuals may make multiple visits to estuarine waters from freshwater residence, as well as individual fish taking-up
residence in the estuary over the late winter-spring period (Figure 17). Eight fish with estuarine-visiting behaviour were logged by VR2s in the Snowy River at Marlo Jetty, Second Island, Little Snowy confluence and Lochend, and in the Brodribb River at the confluence of Cabbage Tree Creek and at the
boat ramp.
Figure 17. (Both panels) Data shows bass location (mean daily distance from the Ocean) for all bass tagged during the present study. The period when four bass (#217, #219, #228 and #229) and one 'putative bass' (#223) in 2004, and two bass (#220 and #225), one F1 hybrid (#218) and the same 'putative bass' (#223) in 2005, visited the lower estuary (< 6km distance from ocean) after residing upstream in the freshwater reaches of the Snowy River can be broadly defined as July to early December (dashed circles). Upper panel shows bass location data overlaid on daily average temperatures at Sandy Point. Lower panel shows bass location data overlaid on daily average flows at Jarrahmond.
Passage across 'sand-slug' reach
Nine tagged individual bass were observed crossing the sand-slug reach at least once during the period January 2004-December 2005. Some individual fish crossed the sand slug several times. Bass #228 crossed five times moving upstream, and six times moving downstream. Passage time, as indicated by the difference between detection times at the Woods Point and Butter Factory acoustic listening stations, may also include time spent on non-travelling behaviours (i.e. residence) within the sand-slug reach. Six of the fish that crossed the sand-slug were later confirmed by genetic analysis as bass; one individual was an F1-hybrid, and two were 'putative bass' tagged at Jackson's Crossing, although not genetically tested (no fin-clip). Downstream crossings were relatively rapid, from a few hours to six days, although #223 spent some time within the reach and took five months to cross. Four fish were observed to make the downstream crossing within single days. The journey usually started at night but often included some daylight hours. For instance, #219 crossed between 02:20 h and 13:24 h on 23 August 2004, #220 crossed between 03:03 h and 16:53 h on 29 September 2005, #228 crossed between 02:33 h and 06:49 h on 11 December 2004, and #229 crossed between 13:30 h and 10:55 h on 19 August 2004. Upstream crossings took longer with most between two and 10 days, although #225 took four months and #228 spent five months in the reach before crossing.
Discussion
Individual bass show movement behaviours far more complex than simple models of mass catadromous spawning migration might suggest (Harris and Rowland 1996). Behaviour of some bass in the first 80 km of freshwater can be described as "reach resident" or having a temporary home-range. They were repeatedly observed for a number of weeks or months at a given location. Some individuals were 'nomadic', making repeated transitions from estuarine to riverine habitats during July-December over at least 50 km of river. While this study cannot definitively answer to what extent these movement are driven by reproductive behaviour, or environmental stimuli, as opposed to other factors such as food or availability of other resources, the scope of these observation is limited to mature fish larger than the size of the smallest tagged bass (275 g). Based on size at tagging, all of the tagged fish were likely to be mature, assuming Snowy River bass grow and mature similar to those in NSW (Harris 1986).
Movement Scale and Behaviour
Bass make catchment scale movements (i.e. 10's of km) at all times of the year and at any time during the day in both upstream and downstream directions, sometimes within a few days. These movements may sometimes coincide with increased flows, but not always. Most of the estuarine visiting behaviour occurred during periods of a trend of rising water temperatures, while none occurred during periods of falling trend in water temperatures. Such movements may be important behaviour related to many other factors in addition to spawning (e.g. habitat choice, water-quality, feeding etc). Of the several significant flow peaks during this study, movement sometimes coincided with the first flow-peaks of autumn. These flows prompted upstream movement followed by a net downstream movement for some fish, or disappearance after a long period of residence, or appearance after a long period of absence for others.
This increase in movement may simply be fish seeking new resources at the first significant opportunity after a sustained summer low level. High turbidity and sediment load was observed associated with the autumn flow peak of 2004 (originating in flows from the Buchan River tributary) may also have caused fish downstream of the Buchan River to move to find better water quality. The subsequent winter flow peak was also coincident with reappearance of absent tagged fish indicating further catchment scale movements. However, most fish showed no movement response to most flow peaks.
Movement and Reproduction
Geographic segregation of the sexes outside the spawning season has been reported for bass generally; "most males remain in tidal waters while females travel further upstream" according to Harris and Rowland (1996). In the Snowy catchment, sex was ascertainable in only a few fish during the tag implantation. Acoustic tagged females #217, #220, and #228 were mainly observed within 50 km of the ocean throughout the study and were later all confirmed as bass. Males #230, #224 and #227 were tagged, and remained >80 km from the ocean all the time. However, none of these males were confirmed as bass. Two were 'putative bass' and one was determined to be an F1 hybrid. It is possible that not all F1 hybrids develop and display normal bass sexual behaviour (i.e. downstream spawning migration and geographic segregation).
During each late winter and through until each mid-summer, estuarine visits and periods of estuarine residence from a number of bass may indicate a phase of reproductive behaviour, although we could not directly observe any spawning behaviour in our tagged bass. Other bass collected during this spring period showed signs of reproductive activity. Seventeen bass were collected (29-31 October 2006) from the freshwater reaches of the Snowy River and Cabbage Tree Creek, by volunteer anglers, for the purpose of aquaculture brood-fish collection. Based on external examination, three males were running with milt and at least one female had recently spawned (i.e. abdomen flaccid, vent red and swollen). Therefore, migration and the subsequent spawning season may extend from the end of July through to at least the end of October. Estuarine visits in the tagged bass did not consistently coincide with flow peaks, and although the base flows increased to 1000-2000 ML/d during this period, bass were found to move extensively in all seasons and scale of movement per se was related to temperature, but not related to daily flows.
Movements were larger when water temperatures were low over winter and early spring and became smaller as temperature increased. The appearance of bass in the estuarine reaches also coincided both years with the onset of increasing daily mean water temperature after the winter minima. Bass were closer to the ocean in winter and spring than other seasons. In winter, increasing temperatures and flows were related to decreasing distance-from-the ocean for bass. In spring, the converse is true, as increasing temperatures and flows in the spring were related to increasing distance from the ocean for bass at locations higher in the catchment.
Five acoustic-tagged bass that were observed downstream of the sand-slug after 28 July were logged near Marlo Jetty, Second Island, Little Snowy confluence and Lochend and in the Brodribb River at the confluence of Cabbage Tree Creek and at the boat ramp. This may indicate that the spawning area is within the reach broadly defined approximately by Lochend downstream to Marlo and up the Brodribb River to the Cabbage Tree Creek.
Daily behaviour
The acoustic telemetry data also provided clear evidence of a diel activity patterns in bass and their hybrids in the Snowy River. However, care must be taken in interpreting this data as the primary purpose of the VR2s was to monitor large-scale movements, and they were not randomly situated. Most were deployed in pool habitat and associated with overhanging trees or other structures (by necessity of the installation method). From real-time telemetric studies of related species such as estuary perch (J. Douglas unpublished data), and observations of bass made by anglers, it seems likely that the cycle of increased detection rate observed during the hours of darkness may indicate increased activity at a habitat-unit scale.
Anglers would probably agree that this is likely to be due to increased foraging activity at night, although no published diet research is available in this area. Most detections of an individual bass were on a single VR2 for a given 24 hr period. Activity cycles may, therefore, indicate a nocturnal increase in the proportion of time spent near VR2s, in pool habitats with overhanging riparian-structure; however, only at a scale relevant to a single VR2 (i.e. ~200 m). This apparent activity cycle may also indicate the day time cryptic behaviour of bass, and their nocturnal movement into more open water. Proximity to hard objects (such as woody snags and boulders) during the day, may cause acoustic signal interference that reduces their probability of detection by a nearby VR2; movement into more open-water at night may increase this detection probability (Dale Webber, VEMCO-Amirex Inc. personal communication).
Movement speed and detection-avoidance
Average speeds recorded by bass are quite fast compared to acoustic-tagged estuary perch in the Snowy River, and radio-tagged golden perch in Lake Eildon (0.02 -2 km/h) (John Douglas unpublished observation). Burst speed swimming ability of juvenile bass of approximately 93 mm TL was determined as 0.12 km/h, in an experimental fishway; this equates to only ~0.36 bl/s. However, speeds measured in the present study are of adult bass (275-485 mm FL) travelling between VR2s, and give an indication of the speed of "migrating" fish, as opposed to small scale feeding movements, or burst-speeds. Some of these downstream movements were also coincident with high flows, which may have assisted downstream passage for individual fish.
Despite tagged fish occasionally being able to skip past some VR2s, the present array of VR2s was a success. It identified catchment-scale movements of 30-80 km, reach-scale movements of 1-30 km and habitat-scale movements via patterns of presence and absence around individual VR2s. In testing, the successful decoding of tags by individual VR2s occurred at ranges of at least 100 m. To avoid code-collisions from nearby tags, the detections occur at random intervals every 90-180 seconds apart. For fish to slip past undetected (i.e. skip) they would have to pass through the whole field of detection (2 x 100 m = 200 m) within the period between detections (90-180 seconds). Maximum observed speed was over 9 km/h and average upstream speed was over 3 km/h. A speed of 4 km/h is equivalent to a fish travelling 133- 200 m within the period between 'pings', or potential detections.
It seems likely that speed alone could easily account for avoidance of detection. For a better detection rate, tags with a shorter delay between detections could be used. The compromise is that such tags have greater power requirements and therefore, a shorter lifespan. One advantage of the present study was that tags enabled replicate behavioural observations on the same fish over two spawning seasons. An alternative may be to site the VR2s at points where fish are likely to hesitate during migration such as immediately below rapids. A trade-off here may be the reduction in decoding efficiency caused by acoustic background noise from the rapids. A solution may be to site VR2s in pairs which effectively increases the detection range at each site and reduces the probability of fish swimming through the range without being detected. Pairing VR2s also offers the advantage of providing more information about direction of movement at each site.
Barriers to movement in the lower river
The precise location of the degraded reach, known as the sand slug, can be variously defined, but the shallowest continuous reach of 'poor-habitat' lies between Orbost and Wood Point.
The study shows that the sand slug doesn't seem to be a barrier preventing migration and movement of adult bass. The exact timing and flow conditions prevalent when fish crossed, is usually unknown. However, many adults crossed upstream when flows were between 284-2062 ML/d. Some crossed multiple times up-and downstream sometimes very rapidly. For example fish #219 swam from Wall Track to Marlo Jetty (a distance of 45 km) in 11 hours with a flow of ~1100 ML/d on the Jarrahmond gauge. The same fish then returned upstream over three days when flows were between 1000 and 1500 ML/d at Jarrahmond.
Adult bass with worn fins and bellies, attributed to migrating over shallow sand, have been reported (Craig Ingram, pers. comm. in A. Lugg and J.Harris, unpublished data). It has been hypothesised that the sand slug reach may be a barrier to adults, as it lacks the large-scale cover and depth preferred by large fish (e.g. adult bass). Adult bass can presumably traverse the ~16 km quicker than small individuals. This strategy may, therefore, limit the exposure of adults to unsuitable habitat by "bolting through it" - i.e. going as quickly as possible. Although, large numbers of juvenile native fish other than bass were observed migrating across the sand slug between Lochend and Long Point (Raadik et al. 2001), fewer migrating juveniles were observed at the upstream end of the slug compared to the downstream end, possibly indicating that some individuals failed to traverse the full length of the slug. Juvenile bass may be similar having less need than adults for depth, but greater need for refuge cover in the sand slug reach. Their slower swimming speed would increase the time they must spend to ascend and, therefore, their exposure to predators.
Conclusions
- While they may occupy temporary home-ranges for durations of weeks- months, bass move frequently and rapidly around the catchment.
- In winter, downstream movement to the estuary consistently coincided with a period after the river temperature minimum. Increasing temperature and flows in the winter are related to downstream movement.
- Conversely, in spring, increases in temperature and flow are related to upstream movement.
- From the end of July until the end of December in 2004 and 2005, during rising temperatures and base flows above 1000 ML/d at Jarrahmond, visits to the estuarine zone were common and possibly related to spawning.
- Estuarine visits were followed by a return upstream to freshwater.
- Reach-scale movements occurred at all times of the day (dusk, dawn, day night). Bass move quickly when travelling distances >5 km (migrating), particularly when moving upstream. Migrating bass were recorded at speeds of up to 9.8 km/h (5.6 body-lengths per second) with average upstream speed of 3.4 km/h and downstream speed of 0.73 km/h.
- Adult bass successfully negotiated the sand slug (a 16 km shallow reach of poor-quality fish habitat) both downstream and upstream under a wide range of flow conditions. Downstream crossing generally took from a few hours to six days, and upstream crossings from two to 10 days. Some fish spent significant amounts of time within the sand slug reach.
- Acoustic-tagged bass show strong daily patterns of behaviour that may reflect their increased nocturnal activity in and around pool-habitat in relatively open water.
- Acoustic tagging and remote listening stations/data loggers are a useful and valid way of collecting life-history information about bass populations in the Snowy River, and other similar applications.
Acknowledgements
Thanks goes to the Freshwater Fisheries Research team at DPI, Snobs Creek, who helped collect the data, Russell Strongman, Karl Pomorin, John Douglas, Andrew Pickworth and Daniel Stoessel. Anne Gason (DPI) helped with the advice on the statistical analyses. Fish capture was assisted by the Hon. Craig Ingram (Independent Member for Gippsland East and 'gun bass angler'!).
The study was part of a broader one supported by Department of Sustainability and Environment, through its Snowy River Rehabilitation Works program (2002-2005); and this project was also funded by the Victorian Government using Recreational Fishing Licence fees (2005-2006).
References
Harris JH (1985) Age of the Australian bass, Macquaria novemaculeata (Perciformes: Percichthyidae) in the Sydney basin. Australian Journal of Marine and Freshwater Research 36, 235-246.
Harris JH (1986) Reproduction of the Australian Bass, Macquaria novemaculeata (Perciformes:Percichthyidae) in the Sydney Basin. Australian Journal of Marine and Freshwater Research 37, 209-235.
Harris JH, Rowland SJ (1996) Family Percichthyidae: Australian freshwater cods and basses. In 'Freshwater Fishes of South-Eastern Australia'. (Ed. RM McDowall) pp. 150-163. (Reed Books: Sydney).
Lucas M, Baras E (2000) Methods for studying spatial behaviour of freshwater fishes in the natural environment. Fish and Fisheries 1, 283-316.
McCarraher DB (1986) Observations on the distribution, spawning, growth and diet of Australian Bass (Macquaria novemaculeata) in Victorian waters. Arthur Rylah Institute for Environmental Research. Technical report series No. 47, Melbourne.
Raadik TA, Close PG, Conallin AJ (2001) Lower Snowy Fish Recruitment Study 2000/2001, Pilot Project Report, Snowy River Benchmarking Project. Arthur Rylah Institute for Environmental Research, Heidelberg Victoria.
Schwartz TS, Beheregaray LB (2008) Using genotype simulations and Bayesian analyses to identify individuals of hybrid origin in Australian bass: lessons for fisheries management. Journal of Fish Biology 72, 435-450.
van der Wal EJ (1983) NSW Bass breeding program well established. In Australian Fisheries pp. 21-22.
Winter JD (1983) Underwater biotelemetry. In Fisheries techniques. (Eds LA Nielsen, DL Johnson) pp. 371-395. (American Fisheries Society: Bethesda, Maryland).