Eildon Pondage Creel Survey Report
![]()
Recreational Fishing Grant Program Research report
John Douglas and Kylie Hall
JANUARY 2010
Preferred way to cite this publication:
Douglas, J and Hall, K (2010) Eildon Pondage Creel Survey Report Recreational Fishing Grant Program Research report. January 2010. Department of Primary Industries. Fisheries Victoria.ISBN: 978-1-74217-956-8 (print)
ISSN: 1833-3478
Table of Contents
Executive Summary
Introduction
Project Aims
Methods
Fish marking
Angler interviews
Angler survey design
Angler information
Angling methods used
When do anglers fish?
Where do anglers come from?
Where do anglers fish?
Financial information
Longevity of stocked fish in the pondage and return rate to anglers
Total mortality calculations
Results
Catch and effort data
Angler information
Angler age and sex
Angler experience
Angler satisfaction
Angling methods used
When anglers fish
Where anglers come from
Where anglers fish
Financial information
Longevity of stocked fish in the pondage and return rate to anglers
Mortality calulations
Discussion
Conclusions
Acknowledgements
References
Appendix 1
Creel Survey Calculation of Total Harvest, Return and Effort
Executive Summary
An angler survey was conducted on the Eildon pondage in Victoria to investigate angler catch rates from this fishery and the return to anglers from the large brood-fish that are regularly released into the pondage by Fisheries Victoria. Information was obtained about anglers' catch, harvest, behaviours and attitudes to current angling regulations and issues.
Over a one-year period (September 2004-August 2005), a total of 3907 anglers were interviewed. The majority of anglers were male and nearly three-quarters of all anglers interviewed were 'occasional' anglers, fishing less than one trip per month.
Stocked trout were found to fully recruit to the fishery after four days at liberty. Of those, most were caught within the first three months after liberation. Tag returns indicate 37% and 47% of stocked brown trout and rainbow trout, respectively, were caught by anglers.
The most common angling method used in the fishery was bait fishing. The most effective fishing method for brown trout was lure fishing; the most effective method for rainbow trout was bait fishing. Higher average catch rates for both trout species were obtained in the mornings and evenings.
Anglers came from a range of locations, both local and interstate, to fish the pondage. The majority of anglers were 'local' from Eildon and Alexandra postcodes.
Introduction
Lake Eildon pondage trout stockings are part of Fisheries Victoria's Statewide fish stocking program that releases more than 1 million fish annually to improve recreational fishing opportunities for anglers. The trout fishery in Lake Eildon pondage is maintained by regular stocking. Many of these fish are two and three-year-old trout, weighing between one and four kilograms each. Angler access to the pondage is very good and the opportunity to catch large trout motivates anglers, making the water body a popular fishery. In August 2004, the Minister responsible for Fisheries announced that the Recreational Fishing Licence (RFL) Trust Fund had allocated $107000 to Fisheries Victoria to stock additional trout into the Lake Eildon pondage and undertake a 12-month angler creel survey. An extra 2000 trout were released over the following two years.
The angler creel survey commenced in September 2004 and ran for one year until August 2005 to 'benchmark' the Lake Eildon pondage fishery by answering the following questions:
- Who catches what, where, when and how?
- How long do stocked trout remain in the pondage before they are caught?
- Where do anglers come from and how much do they spend on their visit to the pondage?
- How satisfied are anglers with their fishing experience at the pondage?
Fisheries managers will use this information to optimise the stocking strategy and, where possible, further improve fishing opportunities at the pondage.
Project Aims
The project aimed to:
- Investigate angler catch, behavior and attitudes in the fishery.
- Estimate the return to the angler from the large ex-brood-fish that are regularly released into the pondage from Snobs Creek.
Methods
The project employed two strategies to address the aims of the research: fish marking and angler interviews. Angler interviews were undertaken to investigate catch and harvest information as well as details of the fisher behaviour and views of the Eildon pondage anglers.
Fish marking
All of the trout released into the pondage were individually dart-tagged to identify the time of stocking. Anglers were encouraged, with signage and a media-release, to report their captures to the phone number on the tag, making sure to note the tag number, date of capture, and broad location of the capture. Incentives such as fishing lures were offered to anglers for any tag returns and capture information.
Angler interviews
ANGLER SURVEY DESIGN
Following a preliminary assessment of the nature of the pondage fishery, including consultation with local Fisheries Officers and local angling club members, a stratified random interview design was developed and implemented. This program was designed to cover the full cycle of the pondage fishery with emphasis weighted on the major catch periods as determined by the pre-creel assessment. The program design was based on the following assumptions: that angling pressure is not consistent throughout the year or through the week but varies with higher pressure from September to April, and on weekends and public holidays; and that angling pressure also varies during the day.
These assumptions influenced the spread of sampling effort and intensity, i.e. the number and location of survey sessions seeking interviews. Interview sessions were stratified according to: season (peak season from September to April and slow season from May to August); day type (weekday or public holiday); and time of day (7-11 am (am); 11 am-3 pm (mid); and 3-7 pm(evening)). An extra session was inserted in daylight savings time in the peak season from 7.00-11.00 pm (late).
Each primary sampling unit (am, mid or evening) was chosen with non-uniform probabilities weighted towards the more popular angling times. This was done so the sampling sessions would occur more often in the primary sampling units that received the most fishing effort to increase the precision of estimates of catch and effort.
The objectives of the creel survey design were to:
- obtain estimates of angler effort (angler hours) and catch (the number of fish caught, including those that are subsequently returned to the water)
- obtain estimates of angler harvest (the number of fish kept, or retained catch)
- obtain estimates of catch per unit effort (CPUE, the catch rate in fish per hour)
- obtain estimates of the number of trout caught by anglers from the various recent trout stockings
- collect information to describe the various anglers who use the lake and their attitudes to current angling regulations and issues.
Angling catch, effort and harvest data were obtained by intercepting anglers while fishing and asking a series of questions. Whenever possible, the harvest was identified, counted and measured. All anglers intercepted were interviewed, and if time did not permit this, then anglers were interviewed in a pre-arranged manner (e.g. on very busy days every second angler was interviewed). Creel clerks undertook the field interviews, which encompassed 200 sessions of 4 hours each. The starting point and the direction of travel for the clerk were randomly chosen from one of four pre-designated locations around the pondage.
Data were recorded for the numbers and species of the total catch; number and species of returned fish; and numbers, size and species of the harvested fish (required to calculate the catch rate and release information). Additional interview questions were asked to provide data on:
- principal method of fishing (bait, lure or fly)
- quantity of gear used (number of rods per angler)
- target species
- time already spent fishing
- estimated time of total fishing period
- level of angler experience ('occasional' - fishing only few times per year, 'regular' - fishing 1-3 times a month or 'active' - fishing more than 3 times per month)
- angler home postcode
- angler rating of fishing-satisfaction on that day
- angler rating of satisfaction with the Eildon pondage fishery overall
- other angling waters fished for trout.
Field survey forms were returned to DPI Snobs Creek and the information was entered into an MS Access database.
Calculations used to determine catch and effort estimates are presented in Appendix 1.
ANGLER INFORMATION
General information regarding angler demographics was summarised and expressed as a percentage of all interviewed anglers.
ANGLING METHODS USED
General information regarding angling methods used was summarised and counts for anglers using each method expressed as a percentage of all the interviewed anglers.
WHEN DO ANGLERS FISH?
General information regarding angler fishing times was summarised and expressed as a percentage of numbers of anglers interviewed per time period (am, mid, evening or late) and by month from all interviewed anglers.
WHERE DO ANGLERS COME FROM?
Home locations of anglers were determined from home postcodes. These were summarised by state and the percentage of anglers from local postcodes (Alexandra and Eildon) was determined.
WHERE DO ANGLERS FISH?
GPS readings were taken at each angler intercept and used to determine where anglers fish. Additional information on where fish were caught (and thus where anglers fish) was collected from tag return trout capture locations.
Financial information
Estimates of angler expenditure were calculated by determining the average dollar value spent by anglers in each day stratum. This was multiplied by the number of those days in a year then those results were added together to determine the annual spend of the pondage angler. Spending estimates were calculated for the total spent on the fishing trip and on how much was spent locally within the Murrindindi Shire. Differences in spending between the peak and slow seasons were estimated. The overall figure was then reduced by 30% to account for items that may be used in other trips to other locations (Brown and Gason 2007), to arrive at the final estimate.
Longevity of stocked fish in the pondage and return rate to anglers
Individually tagged brown trout and rainbow trout were released into the pondage in several batches during the period of the creel survey. Anglers were requested to report tagged fish details via phone and a reward (lure) was provided to anglers reporting details.
According to tagging records, a total of 4181 tagged brown trout and 2356 tagged rainbow trout were released over the period of the survey.
Days-at-liberty (from stocking to capture) for individual trout were estimated from the tag return data. Days-at-liberty were calculated by subtracting the date of capture from the release date. These data were grouped as the sum of tag returns per 30-day periods (months) at liberty to enable total mortality rates to be calculated.
The return rate of stocked fish to anglers was estimated from the total number of tag returns for each species as a percentage of the number of each fish species released.
Total mortality calculations
The monthly instantaneous rate of total mortality (Zm) was determined from the slope of a linear regression of the log-transformed total catch of tagged fish reported as caught per month after release. The annual instantaneous rate of total mortality (Z) is equal to the monthly rate multiplied by twelve. The actual total mortality rate (A) over a year is given by the equation:
A=1-ez
Results
Catch and effort data
Creel clerks undertook 3907 interviews in 200 interview sessions over the twelve-month period of the creel from 1 September 2004 to 31 August 2005 (some anglers were interviewed more than once). The estimated total fishing effort for the twelve month period of the creel was 49,320 angler hours, with a standard error (S.E) of 294 angler hours.
Overall, an estimated 4594 trout were caught during the period of the creel survey, of which 3736 (81%) were harvested (i.e. retained) and 858 (19%) were released.
Estimates of catch and harvest were made (± S.E) as follows: An estimated 3093 (± 58) brown trout were caught, of which 2533 (± 45) (82%) were harvested and 560 (± 27) (18%) were released.
An estimated 1501 (± 45) rainbow trout were caught, of which 1213 (± 41) (81%) were harvested and 288 (± 11) (19%) were released.
An estimated 686 (± 22) redfin were caught, of which 390 (± 17) (57%) were harvested and 296 (± 13) (43%) were released.
An estimated 25 (± 2) carp were caught.
For both trout species combined, the overall trout catch rate was 0.093 trout per hour. Higher catch rates were recorded from the am and evening periods. Catch rates of trout varied with season, time of day and for each trout species. The annual catch rates (derived from the creel data) were 0.063 brown trout per hour of effort and 0.030 rainbow trout per hour of effort. The catch rates for brown trout were higher but showed more variability in the peak season period than in the slow season. Brown trout catch rates (catch per hour) were higher in the peak season (0.07) than rainbow trout (0.03) but in the slow season both catch rates were similar (0.04).
Angler information
ANGLER AGE AND SEX
A broad range of angler ages was observed in the survey. Twelve percent of anglers were aged under 17 years, 18% were aged 18-29 years, 29% were aged 30-44 years, 12% were aged 45-49 years, 25% were aged 50-69 years and 5% were aged 70 years or older. Nearly 17% of interviewed anglers were likely to be exempt from holding a recreational angling licence to fish based on age.
Pondage anglers were found to be predominantly males; only 10% of the interviewed anglers were females.
ANGLER EXPERIENCE
The pondage is popular with people who do not fish often. Sixty four percent of anglers were inexperienced and claimed to fish less than one trip per month('occasional' anglers), 23% of anglers claimed they fished 1-3 trips per month ('regular' anglers) and 13% were 'active' anglers who claimed to fish more than 3 trips per month.
ANGLER SATISFACTION
Twenty-seven percent of anglers who fished the Lake Eildon pondage were satisfied with their fishing on the day they were interviewed. Anglers were asked to rate their satisfaction on a scale of one to five. Ratings of 1 and 2 were regarded as unsatisfactory while ratings of 3 to 5 considered satisfactory. Just under three quarters (73%) of the interviewed anglers reported a rating of one or two.
ANGLING METHODS USED
The most common individual method of angling was bait fishing (60%), followed by lure fishing (14%). Fly fishing was the least popular method with only 2% of the interviewed pondage anglers claiming this as their only angling method. However, some anglers used more than one method; just under a quarter (24%) used a combination of bait, lure and fly fishing methods. The angling method that had the highest average catch rate for brown trout was lure fishing (0.135 fish per hour). The angling method that had the highest average catch rate for rainbow trout was bait fishing (0.048 fish per hour).
WHEN ANGLERS FISH
Anglers fished throughout the day, but more fished in the morning and late evening times. However, this did change between the peak and slow seasons. A higher percentage of anglers fished in the morning in the slow season compared to the peak season. While many peak season anglers fished in the early morning, a higher percentage fished in the afternoon ('evening' session). More peak season anglers fished the 'late' session (dusk) compared to the slow season anglers.
The results of the present study indicate the more productive times to fish the pondage are in the mornings and evenings over the warmer months of the year.
WHERE ANGLERS COME FROM
Anglers came from a range of home locations to fish the pondage. Although 72 interviews were made without a postcode being reported, 395 different postcodes from six states were recorded. Four interviews were made with anglers from Tasmania, 5 interviews with anglers from South Australia, 7 interviews with anglers from, Queensland, 9 interviews with anglers from Western Australia, 31 interviews with anglers from New South Wales and 3773 interviews with anglers from Victoria. Of the Victorian postcodes listed, those considered as 'local' (Eildon 3713 and Alexandra 3714) were the most frequently cited postcodes (286 interviews or 7.3% of the total number of interviews).
WHERE ANGLERS FISH
Anglers fished around the whole pondage but tended to congregate at the access points. Popular areas were along the wall and near the bridge. Based on the tag returns, there are areas where more tagged fish were caught than others. Half of the tag returns came from the lower pondage, 30% came from the top pondage, 9% from around the bridge and 11% from outside of the pondage (from the Goulburn River and some downstream tributaries).
Financial information
The non-adjusted value of Eildon pondage anglers' spending was $2,388,378 (±$20,156). However, this figure was discounted by 30% to account for capital items that may be used again but not necessarily in the pondage. Therefore the estimated total for the year is $1,671,865. Anglers claimed to spend an estimated $1,069,734 (adjusted from $1,528,191 ±$14,331) locally within the Murrindindi shire.
Longevity of stocked fish in the pondage and return rate to anglers
Information was obtained (either by angler reports or creel clerk observations of catch) from 2641 tagged trout (1535 tagged brown trout and 1106 tagged rainbow trout).
Tagging data indicates that 37% of stocked brown trout (n=4181) and 47% of stocked rainbow trout (n=2356) were taken during the period of the creel.
Some trout were caught on their release day and catches peaked on the 3rd day after release (Figure 1). Most stocked trout were caught within the first three months (77% of brown trout and 86% of rainbow trout) and few were caught after 12 months (1.2% of brown trout and 0.3% of rainbow trout). Of the tag returns reported, the longest time at liberty of a tagged brown trout was 22 months; the longest time at liberty of a tagged rainbow trout was 15 months (Figure 2).
Not all tagged trout were caught from the pondage. Some of the stocked trout had passed through the pondage gates, or hydro electric power station outfall, downstream into the Goulburn River. Most escapees were caught from the river downstream of the pondage within the reach between the pondage and Alexandra. Captures were reported from as far away as the Waranga Basin near Rushworth and from Hughes Creek that enters the Goulburn River downstream of Seymour.
Not all anglers retained all the fish they caught and 61 anglers interviewed claimed to have released fish. The reasons for release varied. A quarter (25%) of these anglers let fish go because they were surplus to their needs, 38% let fish go because they were undersized and the remaining 38% let fish go because they were only fishing for sport. Two carp were also reported as released, out of a reported 18 caught, despite the fact that they are a declared 'noxious' species and must not be returned to the water.
A total of 25 tagged fish were caught twice. There were no records of any fish being caught more than twice.
Mortality calculations
The monthly instantaneous mortality rate, based on tag return data, was 0.29 for brown trout and 0.28 for rainbow trout (Figure 3). This represents a monthly fishing mortality of 25% for brown trout and 24% for rainbow trout, and an annual mortality of 97% for brown trout and 96% for rainbow trout.
Eildon Pandage Creel Survey Report
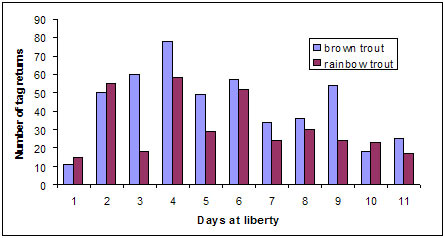
Figure 1 Frequency count of daily tag returns for the first 11 days after release
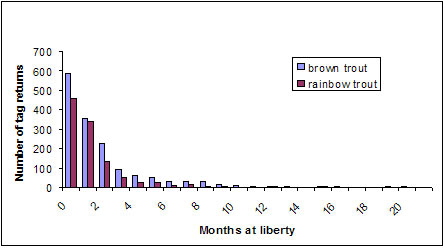
Figure 2 Frequency of tag returns per months at liberty
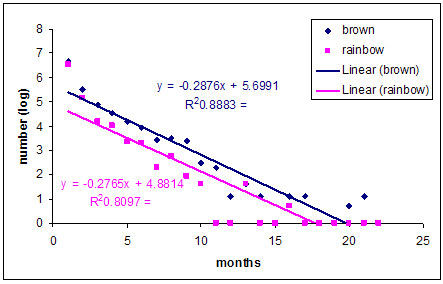
Figure 3 Monthly fishing mortality based on the frequency of tag returns per month
Discussion
The north-east region is recognised as one of the most popular and important recreational fishing regions in Victoria (Explore Australia 1996). Within the region, Lake Eildon pondage and the Goulburn River are the major fisheries (DNRE 2002). The two fisheries compliment each other as the Goulburn River between the pondage and Alexandra is widely considered as Victoria's most patronized wild trout fishery (Weigall 2003). The nearby pondage is a put-and-take fishery—where catchable size fish are liberated by Fisheries Victoria. Of the two fisheries, the pondage attracts even more angler effort than the Goulburn River (Lourey and Mitchell 1994, Brown and Gason 2007) making it the most popular trout fishery in Victoria. Put-and-take fisheries are valuable recreational resources that provide angling opportunities to fishers from novice to expert. This notion is reflected in the management goals for the Lake Eildon Pondage fishery. It aims to "offer anglers the year-round opportunity to take 2-5 kg brown trout and rainbow trout in this unique easily accessible put-and-take fishery, set in pleasant surroundings suited to family or group outings" (DNRE 2002). The findings from the current work validate that the fishery is well patronised by Victorian anglers and that it returns a relatively high proportion of the stocked trout to the anglers.
The performance of the pondage, based on catch rates (fish per hour) is lower than the Goulburn River. The present study did not run a concurrent angler survey in the river section. A creel survey of the river conducted over two trout seasons in 2002-03 and 2003-04 reported catch rates ranging between 0.02-0.04 brown trout per hour and 0.07-0.11 rainbow trout per hour (Brown and Gason 2007). Conversely, in the Lake Eildon pondage, the present data indicates that brown trout had higher catch rates than rainbow trout.
In the present study both species of trout had similar catch rates. This finding contradicts other Australian investigations on the comparative exploitation rates between the two trout species. It is a common belief among recreational fishers that rainbow trout are easier to catch than brown trout. Some Australian studies have reported significantly higher exploitation of rainbow trout than brown trout in lakes (Tilzey 1972, Faragher and Gordon 1992, Douglas and Hall 2004, Brown and Gason 2007). It is not known why the catch rates of the two trout species are similar in the pondage.
The foraging behavior of older trout is known to change in streams (Bachman 1983) and perhaps as rainbow trout get older they are less susceptible to angling. Conversely it may simply be that multiple years' residence in a hatchery prior to stocking makes both species equally 'naive' and thus equally catchable.
If the aim of a put-and-take fishery is for the stocked fish to be caught by anglers, then the pondage fishery is a success, with very high catch returns possible within the first few weeks after release. In the United States of America, the Arizona Game and Fish—Urban lake program reported 80% of the stocked fish were caught within 30 days (Arizona Game and Fish 2007). This is very similar to the Eildon pondage findings where many tag returns were received within the first month post release.
The return rate to anglers from stocked fish in the pondage (37% for stocked brown trout and 47% for stocked rainbow trout) compares favourably with other stocked Victorian waters. In Lake Wendouree, anglers caught 32% of stocked rainbow trout in a year (Douglas and Hall 1994). However, this figure was derived from overall harvest compared to stocking numbers and was estimated from total harvest estimates from a creel survey. The return rate from the pondage is from reported tags only and does not take into account any fish that may have been taken but the tag not reported, any fish that died post stocking and tagged fish that were caught but the tag had dropped out. Tag reporting rates can vary for a host of reasons and lead to underestimation of mortality (Green et al 1983). Higher tag reporting rates are obtained with high value rewards. The present study offered incentives to tag returns by offering lures. Nevertheless, there is a strong possibility that not all captured tagged fish were reported in the present study. No estimates of tag non–reporting were made so this factor cannot be included in the estimates.
Tag loss and non-reporting of tags will underestimate the actual return rate of trout. The reporting rate of tagged trout in a study on the Goulburn River was estimated as 16% (with no reward offered), and tag loss could be up to 10% over three months (Brown 2008).
Satisfaction of anglers on the pondage was slightly higher than that measured on nearby unstocked, wild trout fisheries (Douglas 2004, Brown and Gason 2007). The pondage offers anglers of all capabilities a chance to catch a relatively large trout (compared to other areas in the state) and offers fishing all year (it is not subject to a closed season like the Goulburn River).
Conculsions
The Lake Eildon pondage is a popular angling water with the highest trout-fishing effort in Victoria.
Return rates from stocking are high (37% for stocked brown trout and 47% for stocked rainbow trout), compared to other stocked waters in Victoria.
By postcode, the highest number of anglers fishing the pondage are 'local' (7.5% of Victorians who fished were local) but it does draw people from other areas of Victoria and interstate.
The majority of anglers fishing Lake Eildon pondage were relatively inexperienced–fishing it less than once per month.
Catch rates in the Lake Eildon pondage 2004–05 were less than measured in comparable studies of the nearby Goulburn River and Rubicon River.
Acknowledgements
Stuart Vallis, Russell Strongman, Daniel Stoessel and Peter Grant undertook the bulk of the creel interviews and their effort (early starts and late finishes), enthusiasm and professionalism is to be applauded. Paul Brown undertook creel interviews, assisted in project design and supplied comments on the manuscript and Wayne Fulton assisted in survey design and as well as providing editorial contributions on the manuscript.
This project was funded by the Victorian Government using Recreational Fishing Licence fees.
References
Arizona Game and Fish (2007) Urban lake program website. http://www.azgfd.gov/h_f/urban_faqs.shtml
Bachman RA (1984) Foraging Behavior of Free-Ranging Wild and Hatchery Brown Trout in a Stream.Transactions of the American Fisheries Society, 113:1–32
Bailey P (2007) Proportional angling success: an alternative approach to representing angling success.Fisheries, 32(3): 129–135
Brown P (2008) Goulburn River Trout Fishery: Monitoring and Assessment, Fisheries Victoria Research Report No. 20. Department of Primary Industries, Melbourne Victoria
Brown P and Gason A (2007) Goulburn River Trout Fishery: Estimates of Catch, Effort, Angler-satisfaction and Expenditure. Fisheries Victoria Research Report Series No. 30. Department of Primary Industries, Melbourne Victoria
DNRE (2002) Goulburn-Eildon Region Fisheries Management Plan. Department of Natural Resources and Environment. Victoria
Green AW, Matlock GC and Weaver JE (1983) A Method for directly estimating the tag-reporting rate of anglers. Transactions of the American Fisheries Society, 112:412–415
Lourey M and Mitchell BD (1994) Creel survey report, Goulburn River (Lake Eildon to Alexandra), Summer 1994. Technical Report 94/3 Centre for Aquatic Resources Utilisation and Management. School of Aquatic Science and Natural Resources Management Deakin University
Douglas J (2004) Rubicon River Trout Fishery Assessment. Fisheries Victoria Research Report Series No 19. Department of Primary Industries, Melbourne Victoria
Douglas, J and Hall K (2004) Lake Wendouree Fisheries Assessment. Fisheries Victoria Research Report Series No 7. Department of Primary Industries, Melbourne Victoria
Faragher RA and Gordon GNG (1992) Comparative exploitation by recreational anglers of brown trout,Salrno trutta L., and rainbow trout, Oncorhynchus mykiss (Walbaum), in Lake Eucumbene, New South Wales. Australian Journal of Marine and Freshwater Research, 43:835–45
Explore Australia (1996) The Victorian Fishing Atlas. Ross J. (Originating Ed). Penguin Books. Australia 73pp.
Tilzey RDJ (1972) The Lake Eucumbene trout fishery. The Fisherman (NSW State Fisheries), 4:1–9
Weigall P (2003) Victorian Fly-water. Australian Fishing Network. Croydon Victoria. 112pp.
Appendix 1
Creel Survey Calculation of Total Harvest, Return and Effort
Recorded effort (E), ie. the actual time spent fishing at the time of interview, is calculated by subtracting the fishing start time from the interview time.
Estimated trip effort (EE) is calculated by subtracting the fishing start time from the actual or estimated end time.
The harvest rate (HPUE) of each species each trip is the number of fish retained (N) divided by the recorded effort.
HPUE = N / E
The return rate (RPUE) of each species each trip is the number of fish returned ® divided by the recorded effort.
RPUE = R / E
The estimated harvest (H) of each trip is the harvest rate multiplied by the estimated trip effort.
H = HPUE * EE
The estimated return of each trip is the return rate multiplied by the estimated trip effort.
R =RPUE * EE
The harvest rate of each individual angler (HA) is the estimated harvest of the trip divided by the number of anglers in the fishing party (A).
HA = H / A
The ratio of efforts (RE), a measure of how close to completion a trip is, is the recorded effort divided by the estimated effort.
RE = E / EE
For each combination of season (RE), day-type and time period, or strata, the mean ratio of efforts (MRE) was calculated.
All interviews (i) in an interview session (I) were then summed. Information from trips that were closer to completion were given greater importance using a weighting value (W) equal to the ratio of efforts divided by the mean ratio of efforts.
W = RE / MRE
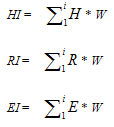
For each interview session, the total harvest (HI), total return (RI) and total effort (EI) were calculated by summing the weighted harvest, return and effort for each interview.
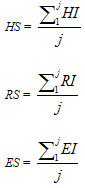
 For each strata, where j is the number of interviews in the strata, the mean harvest per strata (HS), the mean return per strata (RS
) and the mean effort per strata (ES) were calculated by summing the total harvest, the total return and the total effort for each session within the strata, and dividing each by the number of sessions within the strata.
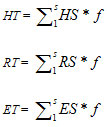
To obtain the estimated total harvest (HT), estimated total return (RT) and estimated total effort (ET) for the entire year, where s is the number of strata, the sum of each of the mean harvest per strata, the mean return per strata and the mean effort per strata multiplied by the total number of possible sessions in each strata, f, was calculated.
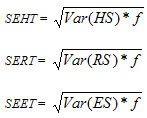
The standard error of each of the estimated total harvest, SEHT, estimated total return, SERT, and estimated total effort, SEET, were calculated by taking the square root of the variance of the mean harvest per strata, the mean return per strata and the mean effort per strata multiplied by the total number of possible sessions in each strata, f.