Statewide Angler Diary Program 1997 - 2003
Figures 21 - 30
Figure 21. Estimated mean retained catch rate (± 2 s.e.) of King George whiting by anglers targeting King George whiting in Western Port (1998-2003).
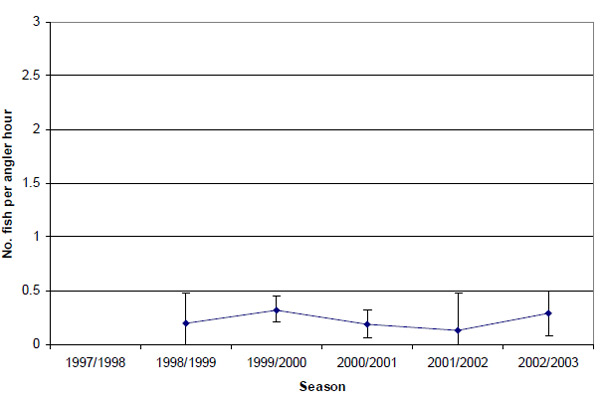
Figure 22. Estimated mean release catch rate (± 2 s.e.) of King George whiting by anglers targeting King George whiting in Western Port (1998-2003).
Figure 23. Size composition of all King George whiting caught (both retained and released) by anglers contributing to the Fishing Diary Program who fished in Western Port from 1998 to 2003 (n=number of fish measure).
Figure 24. Estimated mean total catch rate (± 2 s.e.) of black bream by anglers contributing to the Fishing Diary Program who targeted bream in the Gippsland Lakes (1997-2003).
Figure 25. Estimated mean retained catch rate (± 2 s.e.) of black bream by anglers contributing to the Fishing Diary Program who targeted bream in the Gippsland Lakes (1997-2003).
Figure 26. Estimated mean release catch rate (± 2 s.e.) of black bream by anglers contributing to the Fishing Diary Program who targeted bream in the Gippsland Lakes (1997-2003).
Figure 27. Size composition of black bream, both retained and released, caught by anglers fishing in the Gippsland Lakes from 1997 to 2003 (n=number of fish measured).
Figure 28. Estimated mean total catch rate (± 2 s.e.) of trout (brown amd rainbow) by anglers contributing to the Fishing Diary Program who targeted trout in the Goulburn River (1998-2003).
Figure 29. Estimated mean total catch rate (± 2 s.e.) of brown trout by anglers contributing to the Fishing Diary Program who targeted trout in the Goulburn River (1998-2003).
Figure 30. Estimated mean total catch rate (± 2 s.e.) of rainbow trout by anglers contributing to the Fishing Diary Program who targeted trout in the Goulburn River (1998-2003).
Figure 21
Estimated mean retained catch rate (± 2 s.e.) of King George whiting by anglers targeting King George whiting in Western Port (1998-2003).
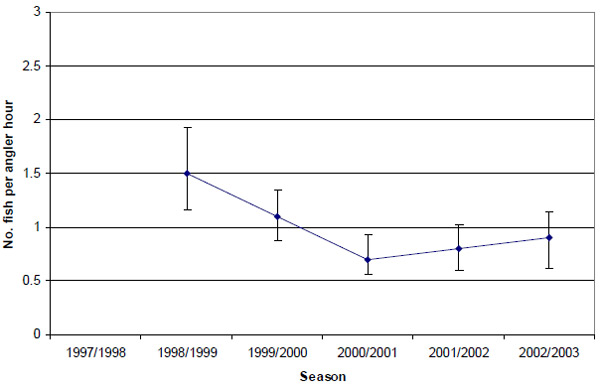
Figure 22
Estimated mean release catch rate (± 2 s.e.) of King George whiting by anglers targeting King George whiting in Western Port (1998-2003).
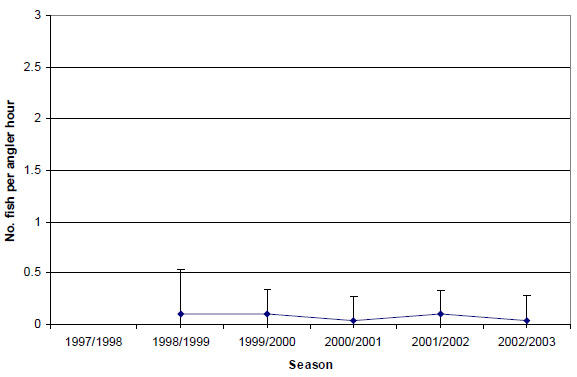
Figure 23
Size composition of all King George whiting caught (both retained and released) by anglers contributing to the Fishing Diary Program who fished in Western Port from 1998 to 2003 (n=number of fish measure).
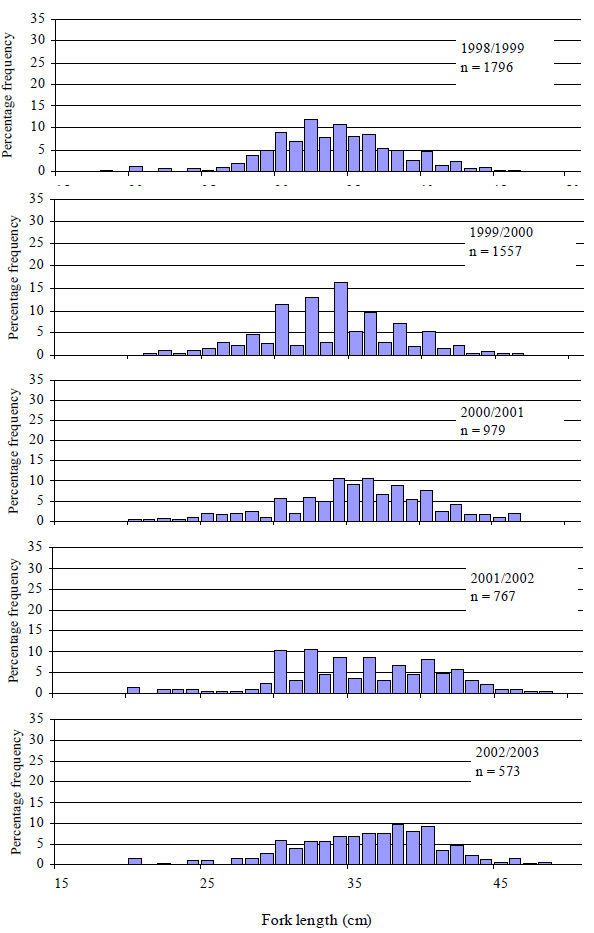
Figure 24
Estimated mean total catch rate (± 2 s.e.) of black bream by anglers contributing to the Fishing Diary Program who targeted bream in the Gippsland Lakes (1997-2003).
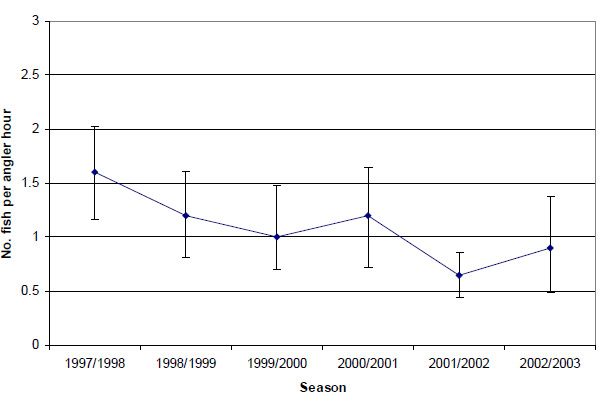
Figure 25
Estimated mean retained catch rate (± 2 s.e.) of black bream by anglers contributing to the Fishing Diary Program who targeted bream in the Gippsland Lakes (1997-2003).
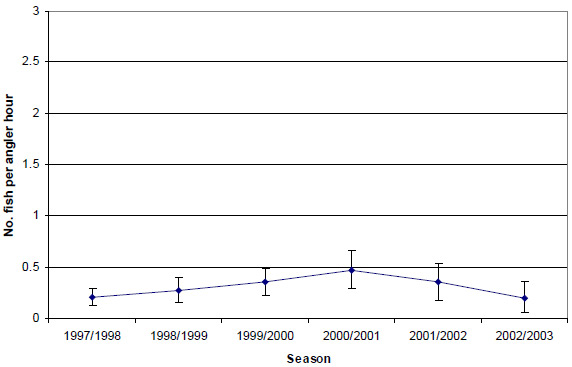
Figure 26
Estimated mean release catch rate (± 2 s.e.) of black bream by anglers contributing to the Fishing Diary Program who targeted bream in the Gippsland Lakes (1997-2003).
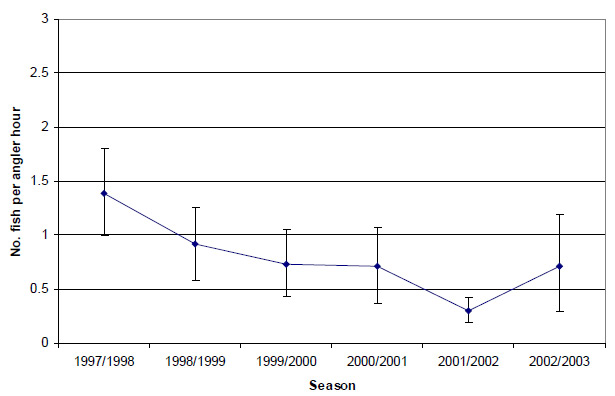
Figure 27
Size composition of black bream, both retained and released, caught by anglers fishing in the Gippsland Lakes from 1997 to 2003 (n=number of fish measured).
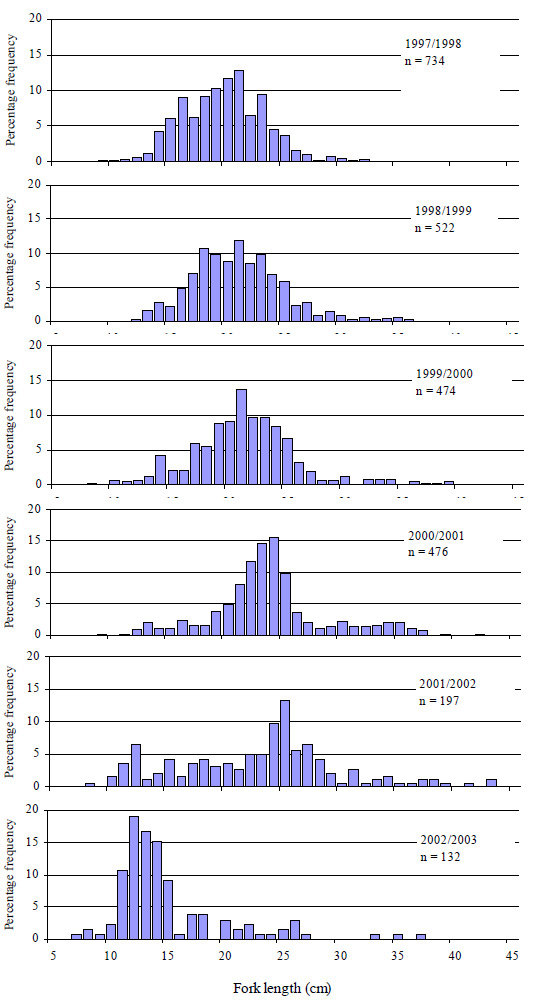
Figure 28
Estimated mean total catch rate (± 2 s.e.) of trout (brown amd rainbow) by anglers contributing to the Fishing Diary Program who targeted trout in the Goulburn River (1998-2003).
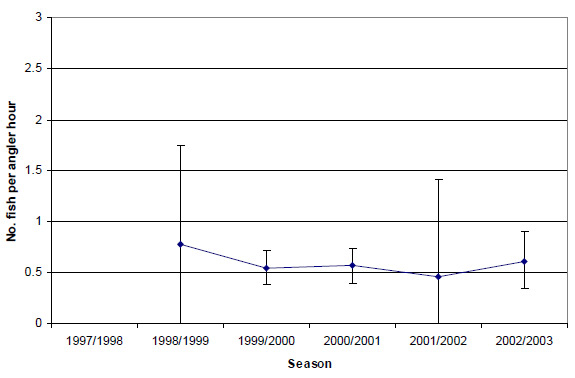
Figure 29
Estimated mean total catch rate (± 2 s.e.) of brown trout by anglers contributing to the Fishing Diary Program who targeted trout in the Goulburn River (1998-2003).
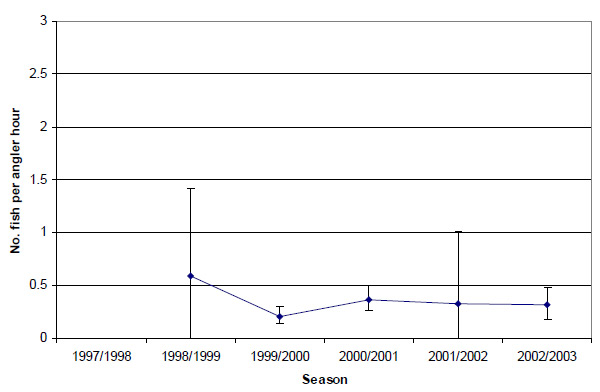
Figure 30
Estimated mean total catch rate (± 2 s.e.) of rainbow trout by anglers contributing to the Fishing Diary Program who targeted trout in the Goulburn River (1998-2003).
Back to Statewide Angler Diary Program 1997 - 2003 table of contents