Fishery Overview
Summary – Key Elements of the Rock Lobster Fishery
Summary – Key Elements of the Rock Lobster Fishery
| Eastern Zone | Western Zone |
Species | Southern rock lobster(Jasus edwardsii) | |
Fishery boundary | Longitude 143o40'E Longitude 150o20'E Latitude 39o12'S | Longitude 143o40'E Longitude 140o57.9'E Latitude 40oS |
Fishing method | Baited commercial pots | |
Primary management method | Quota – individual transferrable quota units and total allowable commercial catch | |
Secondary management methods | Legal minimum length, gear restrictions, closed seasons, permanent prohibition on the retention of soft-shelled rock lobster or females rock lobster in berry | |
Maximum number of licences | 47 | 71 |
Maximum number of licences per boat | Not limited | Not limited |
Total number of quota units | 1000 | 3633.48 |
Minimum quota holding per licence | 5 units | 10 units |
Maximum quota holding per licence | No maximum | No maximum |
Maximum number of pots per boat | 120 | 140 |
Minimum number of pots to activate licence | 15 | 20 |
Total number of pots per zone | 2021 | 5162 |
Legal minimum length | Females = 105mm Males = 110mm carapace length | |
Closed seasons | Females = 1 Jun to 15 Nov Males = 15 Sept to 15 Nov | |
The Species

The Victorian Rock Lobster Fishery is based primarily on one species, the southern rock lobster (Jasus edwardsii), which is found on coastal reefs from the south-west coast of Western Australia to the south coast of New South Wales, including Tasmania and New Zealand.
Southern rock lobsters are found to depths of 150 metres, with most of the catch coming from inshore waters less than 100 metres deep.
The lifecycle of the rock lobster is complex. After mating in autumn, fertilised eggs are carried under the tail of the female for approximately three months before being released, typically between September and November. Once released, rock lobster larvae, known as phyllosoma, live in the plankton and undergo eleven developmental stages over a period of one to two years while being carried by ocean currents.
Adult rock lobsters are carnivorous and feed mostly at night on a variety of bottom-dwelling invertebrates such as molluscs, crustaceans and echinoderms. In Victoria, the abundance of rock lobsters decrease from west to east reflecting a decreasing area of suitable rock reef habitat.
The Fishery
The Rock Lobster Fishery is Victoria's most valuable commercial fishery. Almost all of the catch is now exported to international markets, mostly in Asia, with the remainder sold on the domestic market.
The fishery is divided into two separately managed zones: the Eastern Zone and the Western Zone (Figure 1). The Eastern Zone extends west from the New South Wales border (150o20'E) to Apollo Bay (143o40'E). The Western Zone extends from Apollo Bay west to the border with South Australia (140o57.9'E). The Victorian Government has jurisdiction over the commercial rock lobster fishery in Commonwealth waters adjacent to Victoria through an Offshore Constitutional Settlement Agreement with the Commonwealth Government.
The main ports in the Eastern Zone are Queenscliff, San Remo and Lakes Entrance. In the Western Zone, most catch is landed through Portland, Port Fairy, Warrnambool, Port Campbell and Apollo Bay.
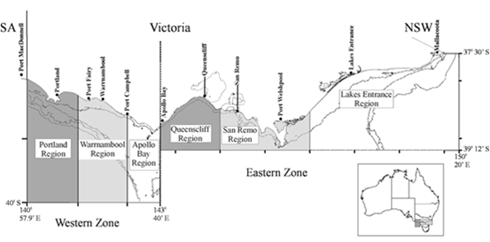
Figure 1: Victorian Rock Lobster Fishery management zones
The Fishing Method
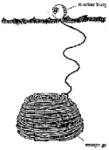
Rock lobsters are caught in beehived-shaped pots that are 1.5 metres wide by 1.5 metres long and 1.2 metres high. The pots have one entrance and escape gaps to allow undersize animals to escape. Pots are tied to lines with identifying buoys that are visible on the surface of the water.
Management Arrangements
The Rock Lobster Fishery is managed through the Victorian Rock Lobster Fishery Management Plan, the primary aim of which is to significantly rebuild the rock lobster stocks in both zones to a level equivalent to 40% of the estimated abundance in 1951.
The fishery is a limited-entry fishery and a Rock Lobster Fishery Access Licence is required to harvest lobsters for the commercial market. Each licence must have at least the minimum requirement of quota units and pots attached to it to be considered as an active licence. In the Eastern Zone, a minimum of 5 quota units and 15 pots are required and in the Western Zone 10 quota units and 20 pots.
Quota units and pot entitlements on fishing licences are separate and independently tradable commodities within the each zone of the fishery. The quota units and pot entitlements can be transferred within the zone either permanently or leased for the quota year. Each zone has a total number of individual transferable quota units and a maximum number of pots.
Since the introduction of a quota management system in 2001, the fishery has been managed through the annual determination of total allowable commercial catch (TACC) for each zone in the form of weight of lobsters. Each licence holder is then assigned a proportion of the TACC in accordance with the quota units attached to their licence, which confers a kilogram value.
In addition to quota management and associated management conditions, the fishery has a number of other management controls including a legal minimum size and closed seasons.
- The legal minimum length for male and female rock is 110 millimetres and 105 millimetres in carapace length, respectively.
- Fishing for rock lobsters is prohibited during closed seasons.
- The closed season for female rock lobsters is from 1 June to 15 November and is designed to protect females in berry (with eggs attached) during the spawning period.
- The closed season for male rock lobsters is from 15 September to 15 November and is designed to protect males during the moulting period when soft shells increase their vulnerability.
Fishery Statistics and Data
Data collected on the fishery comprises catch, effort, growth, length-frequency distribution, pre-recruit abundance and puerulus abundance. The data comes from a variety of sources including commercial fishing activities, observer programs and research programs. The data is used to estimate the abundance of rock lobsters in the water, both legal and undersize quantities. These estimates are then used as part of the annual assessment and total allowable catch determination.
Catch and effort over time
There has been a progressive decline in the abundance of rock lobsters and the catch per unit effort in the fishery over time and TACCs have been adjusted accordingly (see Table 1). In response to concerns about the biomass, the primary strategy of the Management Plan is to significantly rebuild the resource to a predetermined level by 2020/21.
Tables 1 and 2: Victorian rock lobster landed catch and annual total allowable commercial catch (TACC)
Eastern Zone
Quota year | Quota period | EZ TACC set (tonnes) | EZ catch (tonnes) |
|---|---|---|---|
2001-02 | 1 Nov - 31 Mar | 42 | |
2002-03 | 1 Apr - 31 Mar | 60 | 49.9 |
2003-04 | 1 Apr - 31 Mar | 60 | 54.4 |
2004-05 | 1 Apr - 31 Mar | 60 | 53.2 |
2005-06 | 1 Apr - 31 Mar | 60 | 55.7 |
2006-07 | 1 Apr - 31 Mar | 60 | 53.5 |
2007-08 | 1 Apr - 31 Mar | 66 | 50.1 |
2008-09 | 1 Apr - 31 Mar | 66 | 41.3 |
2009-09 | 1 Apr - 30 Jun | 6.9 | 5.8 |
2009-10 | 1 Jul - 30 Jun | 66 | 43.9 |
2010-11 | 1 Jul - 30 Jun | 66 | 64.8 |
2011-12 | 1 Jul - 30 Jun | 66 | 65.3 |
2012-13 | 1 Jul - 30 Jun | 48 | 47.3 |
2013-14 | 1 Jul - 30 Jun | 51 | 50.8 |
2014-15 | 1 Jul - 30 Jun | 59 | 59 |
2015-16 | 1 Jul - 30 Jun | 59 | 58 |
2016-17 | 1 Jul - 30 Jun | 59 | 52.6 |
2017-18 | 1 Jul - 30 Jun | 59 | 57.2 |
2018-19 | 1 Jul - 30 Jun | 47 | 44.7 |
2019-20 | 1 Jul - 30 Jun | 40 | 37.1 |
2020-21** | 1 Jul - 30 Jun | 40 | 31.7 |
2021-22*** | 1 Jul - 30 Jun | 32 | 20.7 |
2022-23 | 1 Jul - 30 Jun | 32 | 17.3 |
**TACC of 40 t + 2.8 t of uncaught quota carried over from 2019/20 due to COVID market impacts in 2019/20 ***TACC of 32 t + 1 t compromised of 10% of uncaught quota for 2020/21
Western Zone
Quota year | Quota period | WZ TACC set (tonnes) | WZ catch (tonnes) |
|---|---|---|---|
2001-02* | 1 Nov - 31 Mar | 320 | |
2002-03 | 1 Apr - 31 Mar | 450 | 440 |
2003-04 | 1 Apr - 31 Mar | 450 | 436 |
2004-05 | 1 Apr - 31 Mar | 450 | 421 |
2005-06 | 1 Apr - 31 Mar | 450 | 405 |
2006-07 | 1 Apr - 31 Mar | 450 | 329 |
2007-08 | 1 Apr - 31 Mar | 380 | 319 |
2008-09 | 1 Apr - 31 Mar | 320 | 244 |
2009 | 1 Apr– 30 Jun | 55.2 | 36 |
2009-10 | 1 Jul – 30 Jun | 240 | 230 |
2010-11 | 1 Jul – 30 Jun | 240 | 237 |
2011-12 | 1 Jul – 30 Jun | 240 | 237 |
2012-13 | 1 Jul – 30 Jun | 260 | 258 |
2013-14 | 1 Jul – 30 Jun | 260 | 260 |
2014-15 | 1 Jul – 30 Jun | 230 | 230 |
2015-16 | 1 Jul - 30 Jun | 230 | 230 |
2016-17 | 1 Jul - 30 Jun | 230* | 209* |
2017-18 | 1 Jul - 30 Jun | 230 | 230 |
2018-19 | 1 Jul - 30 Jun | 245 | 245 |
2019-20 | 1 Jul - 30 Jun | 246 | 225.6 |
2020-21*** | 1 Jul - 30 Jun | 246 | 255 |
2021-22^ | 1 Jul - 30 Jun | 246 | 249.3 |
2022-23 | 1 Jul - 30 Jun | 246 | 246 |
* Complete season catch data available September each year
** Reflects the change in season timing to align with the financial year
***TACC of 246 t + 18.3 t of uncaught quote carried over from 2019/20 due to COVID market impacts in 2019/20
^ TACC of 246 + 3.4 t comprised of 10% of uncaught quote for 2020/21, plus uncaught quote of fishers impacted by the abalone virus
Eastern Zone
Between 1978 (when catch and effort logbooks were introduced) and 1983, the annual catch averaged around 130 tonne but decreased to an average of 66 tonnes per year over the subsequent 16 years (1984 to 2000). Since the introduction of quota management in 2001, catches have ranged between 40 and 65 tonnes (Figure 2).
The effort in the zone generally reflected changes in catch between 1978 and 1987. During the period between 1988 and 2001 however, effort increased substantially and was significantly disproportionate to the level of catch. The introduction of quota in 2001 brought the effort and catch levels back into alignment (Figure 2).
Standardised catch per unit effort (CPUE) decreased from 0.65kg/pot lift in 1978/79 to 0.28kg/pot lift in 1995/96, the lowest level in the history of the fishery. Following annual increases from 1996/97 to 2003/04, CPUE remained relatively stable to 2011. From 2011/12, CPUE increased to 0.54kg/pot lift, the highest level since 1983/84. The following year, during the 2012/13 season, CPUE increased to 0.64kg/pot lift. Since that time, the CPUE has been in decline and in 2022/23 was at 0.49kg/pot lift (Figure 3).
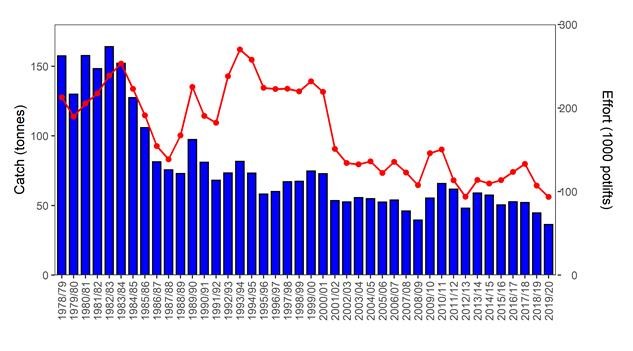
Figure 2: Total catch (blue bars; tonnes) and nominal effort (red line; x1000 potlifts) in the Eastern Zone from 1978/79–2022/23.
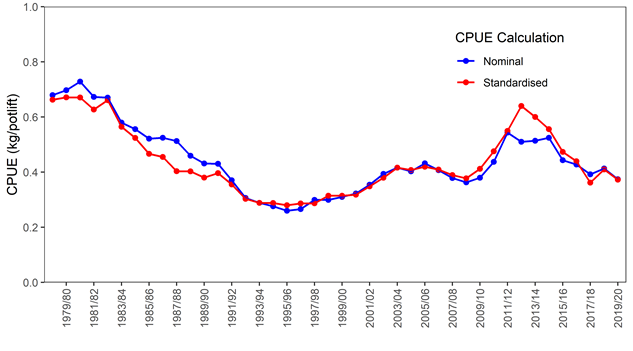
Figure 3: Standardised versus nominal CPUE (kg/potlift) in the Eastern Zone from 1978/79–2021/22.
Western Zone
At the time of logbook introduction in 1978, the Western Zone catch was 486 tonnes. It remained between 400 and 500 tonnes until the mid-1980's, when catch fell to just over 300 tonnes annually. Catches improved throughout the late 1990's, but decreased from 525 tonnes in 2000 to 230 tonnes in 2009/10 with the implementation of a binding total allowable commercial catch. Since 2009/10, annual quotas have been set at between 230 and 260 tonnes and have been fully caught each year (Figure 4).
After consistent decline in the standardised CPUE between 2003/04 and 2009/10, when it reached the lowest level in the history of the zone at 0.34kg/pot lift, the trend reversed and by 2022/23 has improved to 0.79kg/pot lift (Figure 5).
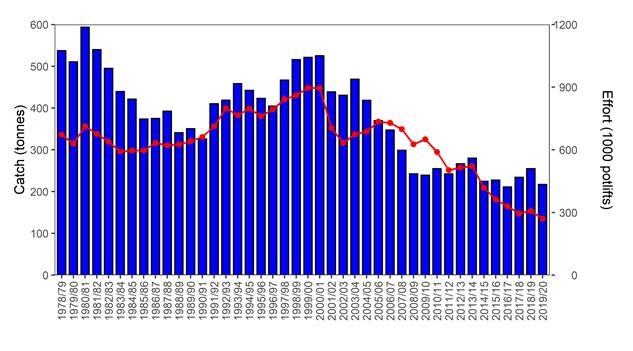
Figure 4: Total catch (blue bars; tonnes) and nominal effort (red line; x1000 potlifts) in the Western Zone from 1978/79–2022/23..
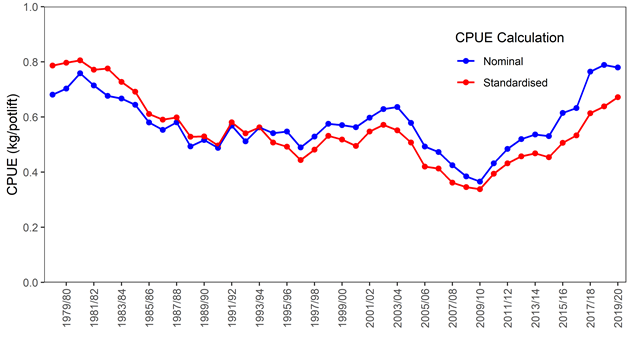
Figure 5: Standardised versus nominal CPUE (kg/potlift) in the Western Zone from 1978/79–2021/22.
Puerulus settlement
After spending 9 to 12 months as planktonic larvae in the water column, lobsters metamorphose into a post-larval stage called puerulus and settle in inshore reef habitat. The numbers of puerulus setting into an area is a good indicator of the health of the future population as there is a strong correlation with catches of lobsters four to five years later.
Trends in puerulus counts have been shown to be highly consistent between the Western Zone of Victoria and the neighbouring South Australian Rock Lobster Fishery (Figure 6). Higher levels of settlement were recorded in 2002, 2005 and 2006 in all regions and are reflected in higher catch rates in subsequent years.
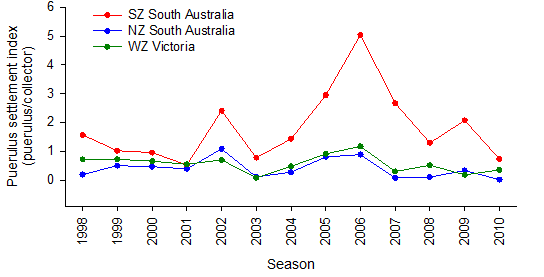
Figure 6: Puerulus settlement index in the Southern (SZ) and Northern Zone (NZ) of South Australia and the WZRLF from 1998-2010.