Sustainability of recreational fisheries for Murray cod
![]()
Recreational Fishing Grant Program Research report
January 2010
Paul Brown
Fisheries Victoria, Fisheries Research Branch
Snobs Creek. Private Bag 20, Alexandra. 3714
Preface
The Fisheries Research and Development Corporation (FRDC) project "Sustainability of recreational fisheries for Murray cod in the Murray Darling Basin" (PI. Wayne Fulton, Fisheries Victoria, 20062009) is collecting detailed information on size at maturity across the basin, estimating the post-release survival of angled Murray cod and developing a Murray cod population model to assist the sustainable management of the species. The present study runs in parallel, and dovetails with this FRDC project and was supported by co-investment from FRDC and Fisheries Revenue Allocation Committee funds generated by the Victorian recreational fishing licence, and by Fisheries Victoria.
Preliminary data from this research (2006-07 surveys) has already been used to interpret outputs of a Murray cod population model in terms that are relevant to the recreational fisher (Allen et al. 2009). The information in this report will feed into current research, outlined above, to enable inferences about post-release survival to be applied quantitatively across the whole fishery (Humphries 2008).
Fisheries Victoria is investing in a further phase of Murray cod research starting in the year 2009-2010 that will optimise a survey design of repeatable stock-assessments to provide reliable abundance indicators to enable improved management of the fishery and its sustainability.
Executive Summary
Background and impact of this research
The present study partially addresses one of the high priority recovery actions described in the Draft National Recovery Plan for Murray Cod; "Action No 5.1: Determine the total annual harvest (including catch and release, unknown, unreported and illegal catch etc) of Murray Cod across the Basin, and within Spatial Management Units (NMCRT in prep 2008. )."
This research is part of the broader research project "Sustainability of recreational fisheries for Murray cod in the Murray Darling Basin" funded by the Fisheries Research and Development Corporation (FRDC) project and is supported by co-investment from FRDC, Fisheries Revenue Allocation Committee funds generated by the Victorian recreational fishing licence, and by Fisheries Victoria. Other aspects of this broader study are collecting detailed information on size at maturity across the basin, and estimating the post-release survival of angled Murray cod, thus addressing several other high priority actions from the Draft National Recovery Plan (NMCRT in prep 2008).
The overarching objective for all of this work is to produce information that can be used to develop a Murray cod population model and to assist the sustainable management of the species. This has been achieved and a population model has been constructed and scaled to the observations of catch and harvest made by the present study. Peer-reviewed research using this model to compare a range of fisheries management scenarios including size-limits (Allenet al. 2009), and stock-enhancement (Rogers et al. in prep.) for Murray cod recreational fisheries is now published.
Observations of the harvest and released component of the catch (present study) have been combined with experimentally determined post-release survival estimates from the FRDC project to evaluate the relative impact of mortality associated with catch-and-release fishing for a range of Murray cod fisheries (Douglas et al. in prep.)
This report provides additional advice to resource managers, researchers and other stakeholders in the fishery, with which they can better understand the nature and potential impact of recreational fishing on Murray cod stocks.
How was it done?
The study used a randomised creel survey design to sample recreational fishing catch and effort within six study-reaches; along the Murray River from Yarrawonga downstream to the South Australian border, and on the lower Goulburn, Ovens and Loddon Rivers. Three reaches were completed in each 9-month Murray cod season (December–August) during 2006-07 and 2007-08.
Anglers were interviewed during or immediately after their fishing activity by researchers patrolling the rivers in boats and four wheel drive vehicles. Each angler encountered was queried about their catch, the time they had spent fishing and a range of angler-behaviours and fishing-practices.
Nearly 1700 km of river reaches were sampled and over 1400 angler interviews were completed, giving a truly representative sample of fishing activity in the fishery in the southern Murray-Darling River system.
How much fishing effort and what was the catch?
nglers' responses were used to estimate that in the study reaches during these two fishing seasons, almost 2 million hours of fishing time was spent by all anglers in the fishery. This is equivalent to between 58 and 253 angler hours per hectare of river for this fishery, making it comparable in intensity of fishing effort to several large east-coast estuarine fisheries (Bucher 2006).
The total Murray cod catch within these study reaches was estimated at over 113,000 fish, of which just over 8000 were harvested.
When stream-area is taken into account the catch estimates for each river reach are equivalent to 2– 13 Murray cod per hectare, with harvest rates observed of 0–1.4 Murray cod per hectare.
Release rate for Murray cod was around 90% overall, with most releases being compulsory as the fish were smaller than the legal minimum length (LML). Voluntary release rates of 14–32% of fish larger than the minimum size limit were observed in the Goulburn and Murray Rivers.
For future comparisons of trends in size-distribution, a standard index of harvestable-size was calculated for each reach studied. This indicated the percentage of Murray cod that were larger than 60 cm that were caught; this ranged from 0 to 16.7% across the reaches studied.
Catch and harvest of 'by-catch' species were also estimated where possible for golden perch, trout cod silver perch, redfin and common carp. Angler's removed over 74 tonnes of carp, an invasive pest species, from approximately 1500 km of stream that was surveyed over the 18 month study. The catch of golden perch was markedly less than that of Murray cod and silver perch in most river reaches studied.
Catch of threatened species, such as trout cod and silver perch was relatively high. Silver perch were caught in similar or greater abundance to carp, in more than half the reaches. The estimated catch of trout cod in the Murray River, downstream of Yarrawonga weir was substantial (over 21000 fish in 350 km of stream).
The reported harvest of trout cod (a protected species) was zero, although some reported harvest of silver perch (also protected) enabled an estimate of illegal catch for this species of around 3200 fish over 18 months. Trout cod were reported as captured further downstream in the Murray River (i.e. Goulburn River confluence) than previously published records.
Where did the angler come from?
In total, 85% of anglers interviewed were Victorian residents. Along the Murray River (in NSW), 76%–89% of anglers interviewed were also Victorians. During the 2007-08 Murray cod fishing season, 16% of those fishing in the Murray River from the SA border upstream to Tooleybuc, were residents of South Australia.
Fishing Licence ownership
Overall, 72% of anglers interviewed were owners of a recreational fishing licence (RFL). Exemption from requiring a licence was claimed by 28%. In Victorian fisheries, such as the Loddon, Ovens and Goulburn Rivers, 22%–37% of interviewees claimed they were exempt from RFL ownership. An important finding was that there were significant differences in Murray cod catch rates between RFL-exempt and non-exempt anglers, suggesting that the RFL-holders database would potentially offer a biased sampling-frame for future surveys.
Fishing methods and behaviours of anglers
Anglers fishing with two rods had significantly higher harvest-rates than those using a single-rod; however, using 3–5 rods achieved similar harvest rates to single-rod users. This suggests that harvest pressure will not be reduced by regulations restricting anglers from 5, to 2 rods; but that potentially, a further restriction to a single rod would achieve some reduction in harvest rate.
Bait fishing was consistently the most popular method for 52–97% of anglers across the reaches studied; 87% of all Murray cod caught by interviewees, were caught on bait. The top three successful baits were cheese, shrimp, and bardi grubs with 24%, 18% and 12% of Murray cod caught on these three respectively. Lures (of all types) accounted for 13% of Murray cod caught.
Uptake of best-practice for released fish survival
Angler's self-reported methods of landing and handling Murray cod, prior to release, were largely inconsistent with agreed best-practice (RecFish Australia). 'Hoisting' the fish out of the water suspended by the line and hook, was common practice, and although 38% reported using a net, this included knotted-mesh nets (unknown incidence) along with knotless mesh. Deep-hooked fish were generally 'unhooked', either by hand or using an instrument, contrary to the best-practice of cutting the line and leaving the hook in the fish.
There is obviously potential 'room for improvement' in the area of fish handling best practice amongst recreational fishers for Murray cod. Fisheries and conservation agencies may need to increase investment in advocacy and education to achieve practice-change.
Selectivity of fishing gear
Lures were better at selecting larger fish; 21% of Murray cod caught on lures were larger than the present 60 cm LML, compared to 2% of those caught on cheese or shrimps. This suggests that changes to angler behaviour in the future, such as increasing the use of lures, may offer a way to reduce the selection of fish smaller than the LML. There was also an indication that anglers using large hooks caught fewer small Murray cod, but not enough anglers were observed using large hooks to make this conclusive.
There was evidence of a relationship between hook size, fish size and the likelihood of a fish being deep-hooked. A fish that is deep-hooked has a higher risk of significant injury and post-release mortality. Small Murray cod (<20 cm) have a low chance of being deep-hooked regardless of hook size. As fish size increases, the chance of deep-hooking increases for anglers using small hooks (hook size <2/0). All fish larger than the present LML of 60 cm that were caught on small hooks, were deep-hooked; whereas, none caught on hooks sized 5/0 and larger were deep-hooked.
There may be some potential to minimise deep-hooking by advocating greater use of large hooks; however, further studies need to be done to evaluate the relative risk of serious injury by deep-hooking with small or large hooks.
Angler's show poor recall ability
Anglers were asked to recall information about their catch of Murray cod and their fishing effort, in terms of hours fished, for the present trip (always within 5-hours of starting fishing), and for their previous trip to that fishery that could have been from half a day ago to several months ago. A catch-rate (fish/hour) was calculated for both 'present' and 'previous' trips In theory, equivalent recall ability about both sets of trips should result in identical distributions of catch-rates across the fishery. However, comparisons of the two sets of catch-rates showed significant biases in anglers' ability to recall catch and/or effort accurately from a previous trip more than 5 hours earlier. This recall bias inflated the average catch-rate by over 400% and the average harvest rate by over 150%, compared to the 'present trip' catch and harvest rates.
This finding has implications for interpretation of results from recreational fishing surveys using off-site interviews or diaries where catch and effort data is recalled by anglers after fishing activity is finished. It also supports the use of on-site interview methods such as those used in the present study to minimise recall biases associated with catch and effort events.
'Benchmarking' the recreational fishery for Murray cod in the southern Murray-Darling Basin
The present study has formed an effective 'benchmark' for the recreational catch, effort and release-rates and useful indices of size-distribution in the catch within this Murray cod fishery. The demographics of recreational fishers in the Murray cod fishery are described further in this report. Levels of compliance with best-practice for the survival of released Murray cod are now known. The incidence of use of various types of fishing gear is described along with some insight into the selectivity that these gears may have within the Murray cod population. This information can now be used to better inform resource managers who have the responsibility for the sustainable management of Murray cod.
Introduction
Murray cod is listed as vulnerable under the provisions of the Environmental Protection and Biodiversity Conservation Act 1999. Advice from the Threatened Species Scientific Committee convened to inform the Minister for the Environment and Heritage was, "it is estimated that the size of the Murray cod population has declined substantially over the past 30 years (conservatively estimated to be at least 30%);" The advice also cited a range of types of habitat degradation held responsible for this decline (McKelleher 2005). A draft recovery plan has been developed in response to this listing.
The Native Fish Strategy (NFS) for the Murray-Darling Basin 2003-2013 considers that overall, native fish numbers in the basin are presently at 10% of pre-European settlement levels. The Strategy identifies a return to 60% of these levels as a key objective (MDBC 2004).
For the 2007–08 Murray cod season, NSW recreational fishing legislation increased the legal minimum length (LML) from 50 to 55 cm (total length). In 2008–09 both NSW and Victoria set the LML to 60 cm, largely because of public and professional concern regarding size at maturity and population sustainability. Other recent legislation has increased the protection from harvest, for large Murray cod, and provided a total moratorium on recreational fishing for Murray cod in South Australian waters.
The last work to quantify the recreational catch for Murray cod fisheries was from a national diary-assisted telephone survey in 2000 (Lyle et al. 2002; Henry and Lyle 2003). This survey relied on anglers' recollections of their fishing events recorded in a diary and relayed to researchers via a telephone-survey. Results pertained to the Australian Bureau of Statistics' statistical divisions and geographic areas, rather than particular rivers or individual waterways (Henry and Lyle 2003). Telephone and diary-based surveys are economical and widely used to sample fisheries for high-value, memorable species, in fisheries with diffuse angler-access; however, they can suffer from recall-bias of catch and/or effort especially from the more avid-anglers or where low-value, less memorable fish species are concerned (Pollock et al. 1994).
On-site surveys of anglers during or immediately following their fishing activity have been widely used in Victoria to estimate fishing-effort, catch and harvest for a range of inland fisheries (Hume 1991; Douglas et al. 2002; Brown and Gason 2007). Advantages of such 'creel surveys', as they are called, include reduced recall (memory) bias, collection of site-specific information, and ability to examine harvested fish for measurement or collection of biological data, etc. (Pollock et al. 1994).
There is uncertainty about the ability of anglers in the Murray cod fishery to accurately recall their fishing events and behaviours during those events. Further investigation is required prior to reliance on these relatively-economical off-site survey methods to generate effort, catch and harvest estimates for this fishery.
The national survey identified the large scale of the fishery; estimating that over 100,000 Murray cod were harvested across the Murray-Darling Basin (Park et al. 2005). The national survey also identified that 77% of the overall catch was released; making this species a priority for more information on post-release survival, and angler's behaviour leading up to release. Around the world there is increasing realisation that survival-rates of fish released after capture by anglers can have a strong bearing on the sustainability of populations (Waters and Huntsman 1986; Muoneke and Childress 1994; Cooke and Philipp 2004).
The present study sets out to measure the impact of angling on Murray cod populations in fisheries popular with Victorian fishers during the 2006-07 and 2007-08 Murray cod seasons; namely the Murray River and the Goulburn, Ovens and Loddon rivers. We identified these rivers as most important as Murray cod fisheries, from the frequency of their use within the responses of anglers interviewed as part of the National Recreational and Indigenous Fishing Survey (NRIFS) (Lyle et al. 2002).
This report is presented as a final report for the project after two years of surveys, and details the estimates of total catch, retained catch, and release-component of the recreational fishery, by season and river-reach, along with analyses of angler behaviour and how the fish were caught and handled prior to release.
Objectives
- Complete a stratified, random, survey of recreational fishers on important Murray cod fisheries for Victorian anglers
- Provide whole-fishery estimates of the Murray cod catch, (retained and released components), effort and catch characteristics (including non-Murray cod by-catch)
- Describe and quantify fishing practices potentially important to the released survival rate for Murray cod.
- Provide estimates of recreational catch & retained catch that can be used in modelling simulations of a range of Murray cod management scenarios
Method
Study Reaches
While the recreational fishery for Murray cod is managed on a state-by-state basis, for reasons of practicality we chose smaller river-reach scale units to survey. Throughout this report each of these survey reaches is referred to as a 'fishery'. However, this is not meant to imply any preference for regional scale fisheries management.
CHOICE OF STUDY REACH
Examination of the data from the national recreational and indigenous fishing survey (NRIFS) shows that during 1998–99, the Goulburn, Ovens and Loddon Rivers were the most important in Victoria; 2.32% , 1.15% and 1.04% of anglers nationally (34% , 17% and 15% of Victorian anglers) who caught Murray cod, fished in the Ovens River, Goulburn River or Loddon River , respectively. This angling effort in the same region accounted for 5.65% of the Australian catch (75% of the VIC catch). In NSW, the Murray River accounted for ~48% of the national effort and ~49% of the national catch while the majority of anglers fishing the Murray River were Victorian residents.
During the first year (2006–07), three study reaches were chosen:
- Reach 1, Murray River from Yarrawonga downstream to Torrumbarry weir
- Reach 2, Goulburn River from the Goulburn weir to the confluence with the Murray River upstream of Echuca
- Reach 3, Ovens River from Myrtleford at the Great Alpine Road bridge downstream to the Pyke Street boat ramp (-36.037742° Lat., 146.175502° Long.) near its confluence with the Murray River.
During the second year, 2007-08, a further three study reaches were chosen:
- Reach 4, Murray River from Torrumbarry weir downstream to Tooleybuc Road bridge
- Reach 5, Murray River from Tooleybuc Road bridge downstream to the South Australian border
- Reach 6, Loddon River from Laanecoorie Reservoir downstream to the Boort-Pyramid Rd
In total 752 kilometres of three rivers in 2006–07, and 1511 kilometres of two rivers in 2007–08, were covered by these surveys (Figure 1).
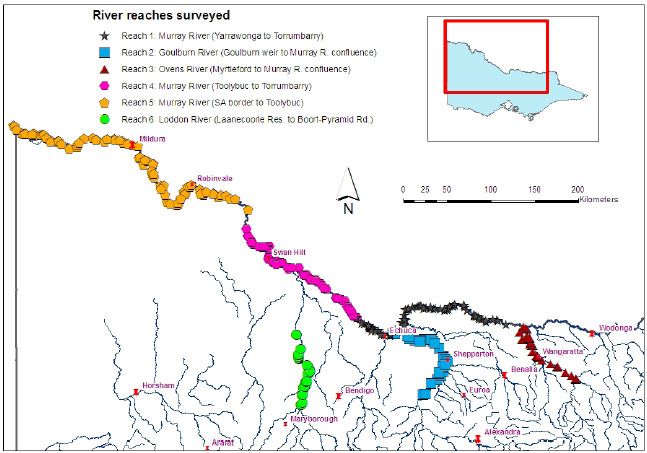
Figure 1. Showing the location and distribution of survey effort during the Murray cod creel surveys over two fishng seasons (2006-2008) along the River Murray and Goulburn, Ovens and Loddon rivers. Each symbol represents the random location where daily survey effort started or ended.
Sampling Design
The design of the creel surveys was developed from a pre-survey questionnaire given to several Fisheries Officers and noted Murray cod anglers who were familiar with the fishery. The questionnaire was designed to gain some idea of the consistency of Murray cod fishing effort, (and catch) throughout the season. Results from the pre-survey indicated that time-of-day, type-ofday, and time-of-year may influence the quantity of effort or the 'catchability' of the fish.
The concept of stratification (of survey effort) into categories of time and space within which catch rates may be expected to be similar, is to reduce the variability around the total estimates of catch or effort that are obtained (Pollock et al. 1994). For example, weekend-anglers in the afternoon may behave differently and have different catch-rate variability than those who fish during the week, say early in the morning. Statistically, it is better to consider these times as separate sample-strata for calculating variance and then combine the variances at a later stage. The 'most appropriate' design for stratification of this survey was obtained by collecting opinions in a pre-creel survey (see below). The statistically random design of the survey makes it likely that this sub-sample of catch rates and anglerbehaviours within the fishery trulyrepresents the whole fishery. The statistical randomisation determines when the creel clerk is on the river collecting data, and not anyone's preconceived opinions about the best, or worst, times to do it.
A pilot study, and meta-analysis of the relationship between survey-effort and the precision of estimates obtained suggested that estimates of fishing effort and catch should be made with adequate precision (15–30 % of the estimate) with around 40-50 interview-shifts for a study reach (Brown, Douglas and Tucker, unpublished data 2006).
Shifts were selected at random with unequal probability from a sampling of all available dates and times within the Murray cod fishing season (1 December –30 August). Sampling effort was distributed across the three strata with unequal probability weightings based on the responses received in the pre-survey. A stratification design was chosen to split the 2006-07 fishing season into two parts; the busy summer period (December –February), and the less frequented autumn winter period (March–August). This was subsequently modified during the 2007-08 fishing season so that the summer period included March. There was a greater intensity of survey effort during the summer periods in both 2006–07 and 2007–08 fishing seasons. We also differentiated weekends and public holidays for more intense survey effort than ordinary weekdays, and in summer on reach 1, scheduled more early and late interview-sessions than mid-day sessions.
The Murray River between Yarrawonga weir and the South Australian border (reaches 1, 4 and 5) is continuously navigable by small boat and many anglers fish from boats, so a boat-patrol was selected as the most appropriate method of sampling anglers in this reach of the Murray River fishery. The Ovens River (reach 3), Goulburn River (reach 4) and the Loddon River (reach 6) are each only partially-navigable by small boat and few anglers fish much of the study reach by boat, most fishing from the bank. Public access is available to a high proportion of these smaller rivers via adjacent public land with vehicle access. Therefore, the Ovens, Goulburn and Loddon Rivers were patrolled by 4x4 vehicle with anglers encountered along the way interviewed as they fished. The minority of anglers who fished from a boat in reaches 3, 4 and 6 were interviewed either by hailing them from the bank, or by intercepting them after they had finished fishing.
For each individual sampling session, the starting location was allocated as a randomly selected map square from the set of all map squares in the VICROADS country street directory, that contained the river-reach being surveyed (RACV 2000). The patrol direction (upstream or downstream) was also chosen at random.
Sampling the catch and effort of anglers occurred throughout three time periods: 06:00 h–11:00 h (early), 11:00 h–16:00 h (midday) and 16:00h– 21:00h (late). Creel clerks patrolled during these periods and asked questions relating to fishing activity. Questions relating to the anglers history of fishing within each fishery were also asked.
SPATIAL REGISTRY OF SAMPLING EFFORT: SEARCHED-AREA METHOD
Due to the large-scale (100's of kms) of the study reaches the project staff could only sample a portion of the entire study reach during each interview session, and this portion varied depending upon river conditions, an accurate system was developed to measure the portion searched and enable the fishing-effort and catch rates to be estimated per unit area (Ha). The most-upstream and most-downstream locations of the reach that was searched for anglers during each interview session, and the locations of each angler interview, were recorded by the project staff on a hand-held global positioning system (GPS). After the fishing season had finished, the river-distance (Appendix 1). An estimate of mean stream-width was made by randomly sampling observable width on aerial photographs (DPI/DSE Image Web Server). An estimate of river-area searched during each interview session was made by multiplying mean stream-width by river-distance searched. Similarly to a standard creel-survey approach, the assumption behind these calculations is that the fishing effort and catch-rate for that area searched is representative of the whole study reach at that time; but our modification allows the searched-area to vary depending on conditions encountered on the day.
ANGLER INTERVIEWS
Survey and questionnaire was based on previous surveys (Douglas et al. 2002; Douglas and Hall 2004; Douglas 2005; Brown and Gason 2007; Stoessel 2008). The interviews collected information on catch and effort, demographics, previous catch history and fishing practices from all anglers encountered during or immediately after their fishing activity.
Anglers were asked firstly about their catch and effort during the interview-shift:
- How long they had fished for, or to estimate how long they would be fishing for, during the interview session?
- How many, and what species of, fish they had caught, and how many and what species they had released after capture, and what was the reason for releasing these fish?
- What was their main method (i.e. bait or lure)?
- How many rods did they use?
- Did they mainly fish from the bank or a boat?
- How many set-lines had they used (question used during season 2006-07 only)?
- Anglers were also asked about their avidity. "How frequently had they fished within this fishery?"
As a surrogate measure of angler avidity (i.e. expertise and eagerness to fish / affinity with the fishery) we used a self estimated experience measure. Each angler classified themselves according to a scale of frequency-of-use (i.e. occasional–regular–active). Where 'occasional' was an angler who fished less than once-permonth, 'regular' was one who fished at least once-per-month and 'active' was at-least once-per-week.
- To explain the demographics of anglers, the place of residence (i.e. post-code) of each angler was also requested.
- To examine the relationship between anglers actively fishing and the population sample obtainable from recreational angling licence databases, anglers were also asked if they held, or were exempt from holding, a recreational fishing licence?
Anglers were also asked about their history of fishing for Murray cod in the present fishery (e.g. Murray, Goulburn, Ovens or Loddon Rivers depending upon place of interview):
- Had they fished previously during the present season?
- If so, could they recall the duration of their last trip, and how many Murray cod they caught during that trip? How many were kept (i.e. harvested).
- Each angler was then asked to recall how many other Murray cod in total (excluding those already discussed) they had captured so far this season, and how many trips they had made to fish there to that date.
For any anglers that reported catching a Murray cod during the interview session, a final series of questions was asked to gather detailed information about each individual capture:
- What was the measured length (self-reported) where this was available?
- Was it harvested or released?
- What bait or lure was used?
- What hook-size and type?
- How was the fish landed?
- What was the anatomical location of the hook-wound?
- How (if) was the hook removed
- Were any injuries noted on the fish?
STATISTICAL ANALYSES
Creel Calculation Methods for Catch and Effort Estimates.
Catch and effort calculations were based on previous methods adapted to allow for the spatial component of the fishery (Brown and Gason 2007). The present study estimated catch-rates per hectare of the portion of the study-reach covered by the interviewers at each interview session. Calculations were all performed within a MSAccess © database with five main queries:
- The first query collates all the effort, numbers of each species caught and released, and a catch and harvest rate for each species for each interview for the area searched during that interview session,
- The second query calculates the sums and variance for catch and effort data for each interview session.
- The third query groups these sums and variances with the relevant numbers of interview sessions and their weighting factors for all strata in the survey-design. Weighting factors are simply the number of possible occurrences of that stratum within the season (e.g. The number of weekday mornings during the summer part of the season).
- The fourth query expands the summed catch and effort data to estimate these for the whole season and reach surveyed using the number of sessions and weighting factors, and known reach dimensions.
- The fifth query calculates the standard errors of each estimate based on the variances.
Hypothesis testing
Catch rate data (CPUE) contains many zero's and, therefore, comparisons of catch-rates using ANOVA required that the data be transformed prior to analysis to meet the assumptions about the normality of the data. This was achieved with fourth root transforms (ie. X→√√X).
Results
Survey Effort
Throughout the 2006-07 Murray cod season, 654 anglers were interviewed on reaches 1, 2 and 3 (Figure 1). Responses of interviewed anglers to questions about their fishing effort lead to estimated total effort for these fisheries of over 1,127,434 h. Effort for each study reach and as density of effort are shown in Table 1 to enable comparisons. Location of interviews along each study reach was not uniform, but adequate coverage of each reach was provided by the level of survey-effort attempted (Figure 1). The Ovens River upstream of Wangaratta was relatively poorly patronised by anglers during the study, probably due to the extremely low flows.
During the following Murray cod season, (200708), 807 anglers were interviewed on reach 4, 5 and 6 (Figure 1). The corresponding estimate of total effort for these fisheries was over 787,400 h. Effort for each study reach and as density of effort are shown in Table 1 to enable comparisons.
Table 1 Summary of interview totals, reach dimensions and estimated angler effort (h) and density ofeffort (h/Ha) for each survey reach
| Study reach | Survey Location | Number of interviews | Reach length (km) | Average stream width (m) | Reach area (Ha) | Angler effort (h) | Angler effort density (h/Ha) | |
|---|---|---|---|---|---|---|---|---|
| 1 | Murray River (Yarrawonga to Torrumbarry) | 498 | 356 | 101 | 3596 | 901 089 | 251 | |
| 2 | Goulburn River | 73 | 244 | 50 | 1220 | 160 661 | 132 | |
| 3 | Ovens River | 80 | 152 | 50 | 760 | 65 584 | 86 | |
| 4 | Murray River (Torrumbarry to Tooleybuc) | 163 | 226 | 72 | 1627 | 237 616 | 146 | |
| 5 | Murray River (Tooleybuc to SA) | 541 | 612 | 134 | 8201 | 474 825 | 58 | |
| 6 | Loddon River | 103 | 106 | 28 | 297 | 75 044 | 252 | |
Catch and Fishing-Effort
During the designated interview sessions, anglers that were interviewed in 2006-07 caught six species of fish including four native species; Murray cod (n=178), trout cod (Maccullochella macquariensis) (n=49), golden perch (Macquaria ambigua) (n=16), silver perch (Bidyanus bidyanus) (n=73), and two alien species, redfin (Perca fluviatilis) (n=3) and common carp (Cyprinus carpio) (n=103).
In 2007-08, anglers that were interviewed caught five species of fish including three native species; Murray cod (n=222), golden perch (n=205), silver perch (n=253), and two alien species, redfin (n=4) and common carp (n=137).
Trout cod and silver perch are protected by threatened-species legislation in Victoria and New South Wales meaning that anglers are legally obliged to return all fish caught. Despite this, occasional illegal harvest of silver perch (n=1 in 2006-07, and n=14 in 2007-08) was admitted by anglers being interviewed, allowing a first estimate of the illegal harvest of this protected species. No illegal take of trout cod was reported or observed.
Common carp are classed as 'noxious species' in Victoria and NSW and it is illegal to return captured fish alive to the water. Despite this, a few carp were actually returned reducing their potential harvest below 100% of the catch.
Overall, 70% of fish caught by interviewed anglers were released each year. Release rates for species were as follows for 2006-07 and 2007-08 respectively: Murray cod (89%, 90%), trout cod (100%, none caught1), golden perch (31%, 66%), silver perch (99%, 95%), redfin (33%, 25%) and common carp (12%, 0%).
The harvested or retained component of the catch by interviewed anglers in 2006-07 was: Murray cod (n=20), golden perch (n=11), silver perch (n=1), redfin (n=2) and common carp (n=91). Retained catch from interviewed anglers during 2007-08 was: Murray cod (n=23), golden perch (n=69), silver perch (n=13), redfin (n=3) and common carp (n=137).
Recorded fishing effort, numbers of all fish species caught and numbers retained during the interview sessions were expanded mathematically using the method described above to estimate totals caught and retained by all anglers fishing the whole study reaches over each whole season. Estimates for total effort, and for each species the catch and retained-catch and their standard errors for season 2006-07 are given in Table 2, and for season 2007-08 in Table 3.
Table 2. Estimates of total effort, catch and harvest (retained catch) and standard errors of the estimates by species, from the recreational fisheries along the study reaches of the Murray (reach 1), Goulburn (reach 2) and Ovens Rivers (reach 3), 1 December 2006—31 August 2007. SE= standard error, ne=not estimable
| Survey Location | Reach 1 | Reach 2 | Reach 3 | ||||
|---|---|---|---|---|---|---|---|
| Estimate | SE | Estimate | SE | Estimate | SE | ||
| Angler Effort (h) | 901,089 | 12,476 | 160,661 | 2,010 | 65,584 | 2,325 | |
| Murray cod | Catch | 45,699 | 4,667 | 7,470 | 311 | 1,777 | 197 |
| Harvest | 4,821 | 3,920 | 238 | 85 | 0 | 0 | |
| Golden perch | Catch | 2,295 | 351 | 3,664 | ne | 1,223 | 255 |
| Harvest | 1,806 | 351 | 1,795 | ne | 360 | 125 | |
| Trout cod | Catch | 21,354 | 802 | ||||
| Harvest | 0 | 0 | |||||
| Silver perch | Catch | 24,952 | 2,866 | 16,215 | 2,132 | ||
| Harvest | 133 | 163 | 0 | 0 | |||
| Redfin | Catch | 526 | 360 | ||||
| Harvest | 526 | 0 | |||||
| Common carp | Catch | 31,298 | 3,784 | 385 | ne | 2,704 | 214 |
| Harvest | 30,551 | 3,859 | 275 | ne | 1,245 | 169 | |
Table 3. Estimates of total effort, catch and harvest (retained catch) and standard errors of the estimates by species, from the recreational fisheries along the study reaches of the Murray (reach 4 & 5), Loddon Rivers (reach 6), 1 December 2007—31 August 2008. SE= standard error, ne=not estimable
| Survey Location | Reach 4 | Reach 5 | Reach 6 | ||||
|---|---|---|---|---|---|---|---|
| Angler Effort (h) | 237,616 | 39,454 | 474,825 | 4,917 | 75,044 | 2,503 | |
| Murray cod | Catch | 19,654 | 2,170 | 38,132 | 2,596 | 551 | 409 |
| Harvest | 796 | 478 | 1,897 | 997 | 418 | 408 | |
| Golden perch | Catch | 9,518 | 387 | 34,009 | 4,002 | 788 | 92 |
| Harvest | 796 | 478 | 12,871 | 2,445 | 589 | 92 | |
| Silver Perch | Catch | 32,231 | 3,997 | 36,659 | 2,525 | ||
| Harvest | 2,869 | 2,235 | 221 | 133 | |||
| Redfin | Catch | 367 | ne | 169 | ne | ||
| Harvest | 367 | ne | 36 | ne | |||
| Common carp | Catch | 4,879 | 548 | 28,913 | 1,427 | 8,213 | 3,993 |
| Harvest | 4,879 | 548 | 28,913 | 1,427 | 8,213 | 3,993 | |
DENSITY OF FISHING-EFFORT AND CATCH
The spatial dimensions of each study reach were used to calculate an approximate area in hectares for the fisheries. The total estimates are divided by this area to produce overall mean estimates of the density of fishing-effort, catch and retained-catch per hectare (Table 4).
Each of the fisheries experienced different densities of angler-effort, with the Murray River (Yarrawonga to Torrumbarry) and Loddon River the most heavily fished at 253 h/Ha and 251 h/Ha, respectively. The most lightly fished reaches were the Ovens River and Murray River (Tooleybuc to SA) at 86 h/Ha and 58 h/Ha, respectively.
Coefficients of variation (CV) for angler-effort estimates were generally less than 5% of the estimates, although CV for effort on reach-4 (Murray R. Torrumbarry to Toolybuc) was high at 17% of its estimated effort. CV for the catch estimates was higher but still generally low (4– 11%), with the CV for catch on reach-6 (Loddon R.) of 74% indicating high variability in the catches for this reach. Estimates of harvest were associated with much higher CV ranging from 36% to 98% of estimated harvest.
Table 4. Estimated density of effort, catch and harvest (retained catch) per hectare by species, for therecreational fisheries along the study reaches of the Murray (reach 1), Goulburn and Ovens rivers(reaches 2 & 3) during 1 December 2006–31 August 2007; and the Murray (reaches 4 & 5) and Loddon(reach 6) rivers during 1 December 2007–31 August 2008.
Reach 1 Murray R. | Reach 2 Goulburn R. | Reach 3 Ovens R. | Reach 4 Murray R. | Reach 5 Murray R. | Reach 6 Loddon R. | ||
|---|---|---|---|---|---|---|---|
| Angler Effort (h/Ha) | 251 | 132 | 86 | 146 | 58 | 253 | |
| Murray cod | catch/Ha | 12.71 | 6.12 | 2.34 | 12.08 | 4.65 | 1.86 |
| harvest/Ha | 1.34 | 0.19 | 0 | 0.49 | 0.23 | 1.41 | |
| Golden perch | catch/Ha | 0.64 | 3.00 | 1.61 | 5.85 | 4.15 | 2.65 |
| harvest/Ha | 0.50 | 1.47 | 0.47 | 0.49 | 1.57 | 1.98 | |
| Trout cod | catch/Ha | 5.94 | 0 | ||||
| harvest/Ha | 0 | 0 | |||||
| Silver perch | catch/Ha | 6.94 | 13.29 | 19.81 | 4.47 | ||
| harvest/Ha | 0.04 | 0 | 1.76 | 0.03 | |||
| Redfin | catch/Ha | 0.15 | 0.47 | 0.04 | 0.57 | ||
| harvest/Ha | 0.15 | 0 | 0.04 | 0.12 | |||
| Common carp | catch/Ha | 8.70 | 0.32 | 3.56 | 3.00 | 3.53 | 27.67 |
| harvest/Ha | 8.50 | 0.23 | 1.64 | 3.00 | 3.53 | 27.67 |
Angler Avidity
The null-hypothesis tested was that 'Murray cod catch rate and harvest rate do not differ among avidity groups'. Although the more experienced anglers ('regular' and 'active') had the highest catch and harvest rates for Murray cod (Figure 2), the variability in catch (and harvest) rates was Angler Avidity high and there were no significant differences The null-hypothesis was accepted for total catch-rate (ANOVA, F=2.39, p=0.09, df=2), and for harvest-rate (ANOVA, F=1.35, p=0.26, df=2).
Table 5 Number of anglers self-classifying their avidity for the fishery in which they were interviewed as 'occasional' (<1 x month), 'regular' ( ≥1 x month >1 x week) and 'active' (≤1 x week).
| Survey reach | Occasional '<monthly' | Regular '≥monthly' | Active '≤weekly' |
|---|---|---|---|
| Reach 1 - Murray River (Yarrawonga to Torrumbarry) | 218 | 157 | 109 |
| Reach 2 - Lower Goulburn River | 35 | 24 | 13 |
| Reach 3 - Lower Ovens River | 56 | 18 | 5 |
| Reach 4 - Murray River (Toolybuc to Torrumbarry) | 75 | 38 | 50 |
| Reach 5 - Murray River (SA to Toolybuc) | 331 | 90 | 119 |
| Reach 6 - Loddon River | 41 | 28 | 34 |
| Totals | 757 | 355 | 331 |
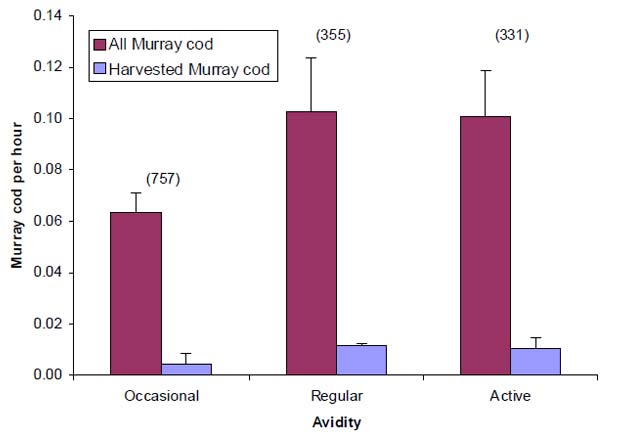
Figure 2. Mean (±SE) catch rates and harvest rates for Murray cod by anglers who selfassessed their participation in the fishery as 'occasional', less than once per month; 'regular', at least once per month, or 'active', at least once per week. No significant differences among groups. Sample sizes are in parentheses.
Angler Demographics
Anglers who supplied their home post-code (n=1438) were distributed across 306 post-code districts in five States ). Anglers from Victorian households represented 84%, of respondents interviewed on the Murray River (reaches 1, 4 & 5) and 93% on the Goulburn, Ovens and Loddon Rivers. South Australian residents were predominantly fishing the Murray (reach 5) near the border with South Australia (n=87) during the 2007–08 season.
Table 6. Percentage distribution of the state of residence of anglers interviewed during creel surveys
| Survey reach | VIC | NSW | SA | QLD | WA |
|---|---|---|---|---|---|
| Reach 1 - Murray River | 89% | 10% | 1% | ||
| Reach 2 - Lower Goulburn River | 98% | 2% | |||
| Reach 3 - Lower Ovens River | 82% | 17% | 1% | ||
| Reach 4 - Murray River | 96% | 4% | <1% | ||
| Reach 5 - Murray River | 76% | 7% | 16% | 1% | |
| Reach 6 - Loddon River | 97% | 2% | % | ||
| Total | 85% | 8% | 6% | 1% |
Recreational Fishing Licence Ownership
Approximately 72% of all anglers interviewed responded that they had a recreational fishing licence (RFL) relevant for the water they were fishing (ie. a NSW RFL for the Murray River or a Victorian RFL for the Ovens, Goulburn or Loddon Rivers). The remainder claimed to belong to one of the exempt categories and therefore did not require an RFL. There was little variation in these proportion across the six reaches studied and the overall distribution across the four exempt categories is shown below (Figure 4). Only 2 anglers interviewed said that they were not exempt but did not have a RFL. The proportion of anglers that had a RFL varied from 63% on the Ovens River to 78% on the Goulburn River. Eight anglers interviewed on Victorian fisheries claimed, mistakenly, that they were exempt due to their age (>70 years), or their aboriginal status. These exempt categories exist in NSW, no such exempt categories exists in Victoria. Murray cod catch rates of anglers exempt from requiring an RFL were significantly lower than those of anglers requiring an RFL (ANOVA, F=13.3, p=0.0003, df=1 ) (Figure 3).
Table 7. The percentage of angler interviewees that responded that they "did require", or "wereexempt from the requirement of", a Recreational Fishing Licence for either NSW waters (reaches 1, 4 & 5) or Victorian waters (reaches 2,3 and 6)
| Recreational Fishing licence ownership | Combined Total | Reach 1 Murray R. | Reach 2 Goulburn R. | Reach 3 Ovens R. | Reach 4 Murray R. | Reach 5 Murray R. | Reach 6 Loddon R. |
|---|---|---|---|---|---|---|---|
| Yes | 72% (1040) | 74% (367) | 78% (56) | 63% (51) | 70% (114) | 71% (377) | 69% (75) |
| No (exempt) | 28% (410) | 26% (128) | 22% (16) | 37% (30) | 30% (48) | 29% (155) | 31% (33) |
| No (illegal) | 0.4% (2) | 0.4% (2) |
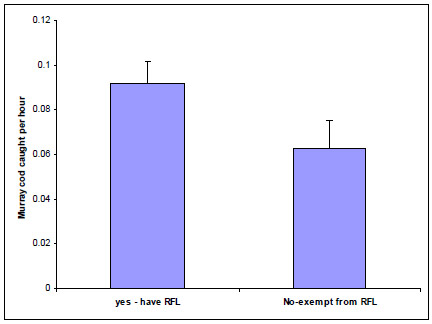
Figure 3. Average Murray cod catch rates (error bars = 1SE) for anglers who held an RFL compared to those who were exempt from holding an RFL. ANOVA shows significant difference (F=13.3, p=0.0003, df=1)
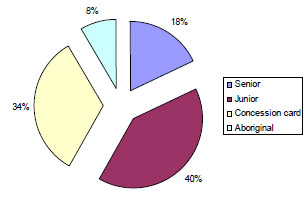
Figure 4. The proportional distribution of those thatresponded that they were exempt from requiring an RFL (n=410), by exemption category.
Angling Method characteristics
Boat vs bank
In the Murray River study reaches (1, 4 & 5), most anglers (n=1168) that were interviewed identified a main fishing platform (i.e. 'boat' or 'bank'). Of these anglers, 68% fished mainly from a boat compared to only 32% bank-fishing. On the Goulburn, Ovens and Loddon Rivers (study reaches 2, 3 & 6) the pattern was reversed, with 244 anglers identifying one main fishing platform; 36% fishing from a boat while 64% fished mainly from the bank. In both the Murray River (df=1, F=33.7, p<0.001) and the Victorian tributaries (df=1, F=6.5, p=0.01) catch rates for Murray cod were significantly higher for anglers who used a boat as their main fishing platform (Figure 5).
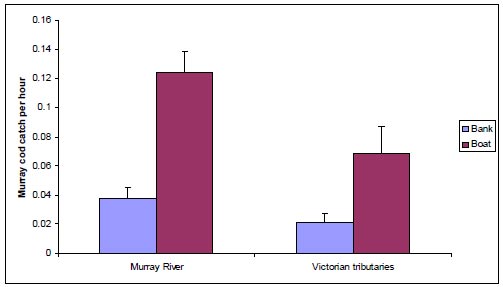 Figure 5. Average Murray cod catch rates (±SE) for anglers fishing mainly from a boat orfrom the bank. For the Murray River (reaches 1, 4 & 5) (n=1168) and the Victorian tributaries (reaches 2, 3 &6) (n=244) catch rates were higher for boat-fishing anglers (Murray River,F=33.7, p<0.001; Victorian tributaries, F=6.5, p=0.01)
DO MORE LINES INCREASE CATCH?
Set-lines vs rod-lines
Limited analysis was possible on the use of set-lines as these 'unattended lines' are illegal in Victoria and were only a legal method in part (~60%) of the Murray River (reach 1) studied in 2006-07. By 2007-08, set-lines were illegal throughout NSW. Of the anglers asked "if /how many setlines they had in the river", 19 out of the 500 who responded (<5%) acknowledged that they were fishing with set-lines. Eleven anglers had 4-set lines each, the remainder claimed from 1 to 3 setlines giving a total of 57 setlines. The use of setlines made no statistical difference to angler's catch-rates for Murray cod. The average catch rate of Murray cod for anglers with up to 4 setlines was 0.15 Murray cod per hour in comparison with the rate of 0.11 Murray cod per hour for anglers with no set lines. Only seven Murray cod were reported as caught on setlines and measured (15–58 cm, TL) so a comparative analysis of the size structure of the catch on setlines vs. rod lines was not performed.
Figure 6. Average Murray cod catch rate (error bars= 1SE) of all anglers interviewed in reach one, in 2006-07, that used at least one setline (n=19; compared with those not using any setlines (n=474).Although CPUE was higher for setline anglers a two sample T-test assuming unequal variance shows that this difference was not significant.
Multiple rod-lines
Over both fishing seasons and all surveyed reaches, the responses from 1438 anglers who were asked, "how many rod-lines are you fishing with?" indicated that, 815 (57%) were using a single rod line, 587 (41%) were using two rod-lines, 36 (3%) were using from 3–5 rod-lines. On the Victorian tributaries; (the Ovens River, Goulburn River and Loddon River) the pattern was similar with 43%, 53%, and 4% using 1, 2 or 3–5 rod-lines respectively. The harvest rate (retained catch of Murray cod per hour) was significantly higher for anglers using two rods, compared to those using a single rod (ANOVA, F=16.1, p<0.001, df=1) (Figure 7). However, the use of multiple rods did not make anglers any better at catching Murray cod overall. The Murray cod catch rate of anglers fishing with 1 to five rod-lines was not significantly different (ANOVA, F=1.34, p=0.25, df=4), and there was no difference in Murray cod catch rate (released and retained catch) between anglers using a single or two-rods (Figure 7).
Figure 7 Mean catch rate (±SE) of all Murray cod (squares) and harvested Murray cod (diamonds) for anglers using from one to five rods. Harvest rate of anglers with two-rods was significantly higher than those using one rod. Number of interviews in parentheses. No significant differences between catch rates for all Murray cod.
BAITS AND LURES: ANALYSIS OF ANGLER METHODS
Most anglers interviewed identified either 'bait', 'lure' or 'bait and lure' as their main method (n=1455). In all study reaches, bait was consistently the most popular with from 52% to 97% of anglers choosing this as their main method. The overall proportions for all reaches pooled were 80% bait, 13% lure and 7% bait and lure fishing. The proportional distribution varied according to angler avidity. While bait was the most popular for all avidity-classes, 27% of the more avid 'active' anglers choosing lure fishing as their main method while 10% and 7% of less avid 'regular' and 'occasional' anglers chose lure fishing (Figure 8). Regular and Occasional anglers showed similar preference for bait fishing (83%). Active anglers were also more specialised focussing on a single method, with fewer choosing the 'bait & lure' option (4%) in comparison with 7% and 9% of regular and occasional anglers.
Figure 8. Proportional distribution (%) of main fishing method by angler avidity classification. Active anglers fish at least once per week, regular anglers fish at least once per month, occasional anglers fish less than once per month. N=1439 anglers interviewed.
Baits accounted for 87% (n=288) of all Murray cod caught by interviewed anglers who specified the bait or lure used (Figure 9). The remainder (13%) were caught on lures, including hard-bodied lures (8%) and spinner baits (3%). Successful baits for Murray cod included artificial baits such as cheese (24%) and chicken (1%), and natural baits such as shrimp (Macrobrachium australiense) (18%), bardi grubs (Abantiades marcidus) (12%) yabbies (Cherax destructor) (8%), worms (8%), mussel (Velesunio spp.) (1%) and assorted cocktails or multiple-combinations of the above (5%).
The proportions of the catch retained or released were not distributed evenly across the main bait/method types and this seems likely to be due to the apparent size-selection of Murray cod caught on some baits and lures. Lures caught more larger fish and less smaller ones; Murray cod caught using cheese tended to be small (Figure 10).
Figure 9 The percentage distribution of baits and lures that were used during successful Murray cod captures (n= 331)
Figure 10. Length distributions of Murray cod (n=189) caught on the two most popular baits, and of allthose caught on lures. 2% of Murray cod caught on cheese and shrimps, and 21 % caught on lureswere larger than the present legal minimum length (60 cm TL).
HOOKING STATISTICS
Hook size - Cod size
Anglers catching Murray cod were asked to identify the hook-size (from a standard chart) and hook-type used (single or multi). Lure fishers generally used multi-hooks (mainly trebles) but some single hooked lures were recorded (e.g. spinner baits). Multiple-hooks accounted for 11% of the Murray cod caught.
Bait fishers used a variety of sizes of single hook from the small size-6 up to large size-7/0. Most Murray cod were caught on sizes 1/0 to 4/0 single hooks.
Larger single-hooks (5/0 to 7/0) caught proportionally more fish larger than a LML of 60 cm than smaller hooks (<=4/0) but the sample size for fish caught on larger hooks is small (n=9). Given the small number of large fish measured, and the scarcity of large hooks used, there was no strong relationship between size of single-hook and size of Murray cod caught.
Hook size and hook-wound location
Anglers were asked to recall the hook-wound location (deep, shallow or external) for each Murray cod caught. The proportions of fish deep-hooked using multiple-hooks (i.e. lures) and single hooks (i.e. mainly bait) were similar at 24% and 29% respectively. Overall, 77 (29%) Murray cod caught on single-hooks during the creel surveys were deep-hooked out of 270 (where a hook location and type was recorded), giving an overall probability of deep-hooking of
0.29. The probability of deep-hooking varied with respect to hook-size and fish size. The proportion of deep hook-wounds is expressed as the probability of a fish being deep-hooked and is presented by hook-size and fish length in Figure 11. When small-sized hooks were used (size ≤1/0), the probability of deep-hooking Murray cod was low with small fish but increased markedly with the size of the fish, so that fish below the LML of 60 cm could have an almost even chance (p=0.5) of being deep-hooked. Using hooks size 5/0 and larger, the probability of deep-hooking fish remains low (p<0.15) independently of fish-size.
Table 8. Proportion of Murray cod caught on single-hooks and measured during the creel survey. n=sample size. Small hooks were up to 4/0 size; large hooks were size 5/0 or larger. LML =60 cm, total length.
| small hooks (n=274) | large hooks (n=9) | |
|---|---|---|
| <LML | 97% | 89% |
| >LML | 3% | 11% |
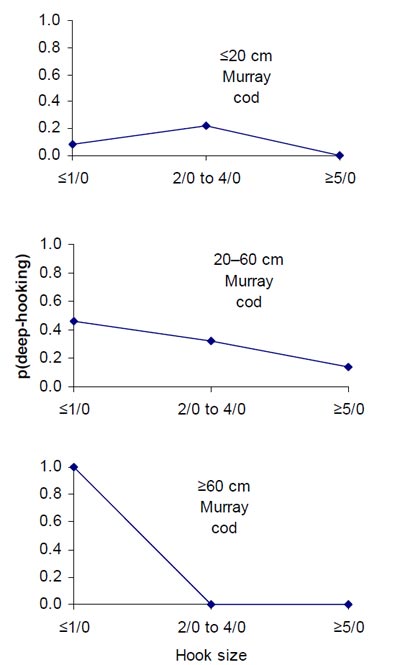
Figure 11. The probability of Murray cod being deep-hooked, for fish caught using single hook (n=269fish of known length), with respect to three fish length-classes and three hook size-classes.
LANDING AND HANDLING
Anglers were asked to describe how they landed each Murray cod captured during the creel-interview sessions and how they unhooked the fish. They were also asked if any injuries were obvious on the fish (e.g. bleeding, eye-damage, etc).
The method of landing (removing the fish from the water) was recorded for 359 captured Murray cod. Overall, 50% were landed 'by hand' although as the survey developed it became clear that this included those who had lifted the fish out of the water suspended by the line in addition to those who had used their hands to cradle and lift the fish out of the water. The next most common landing method was to use a net (38%). Only 5% were landed with a 'jaw gripper', a device which secures the fish by clamping over the jaw before the fish is lifted from the water. Few fish were beached (6%) although this was relatively more common with bank fishers for obvious reasons. The remainder, 1% were unhooked in the water.
The method of unhooking was provided for 359 Murray cod captures where the fish was subsequently released. Fish that were released were generally unhooked, either by hand (70%) or by using an 'instrument' generally pliers, or forceps etc (23%). For the remainder (7%) the hook was left within the fish. Of the Murray cod that were 'deep-hooked' (n=87), 34% were unhooked by hand, 38% unhooked by instrument and 28% left retaining the hook.
Anglers reported no observed injuries (other than the hook wound itself) for 91% of all Murray cod caught and subsequently released (n=348). Injuries were reported for 3% of these fish, with anglers not recording an answer for a further 6% (they often said "I don't know didn't look"). Deep-hooked fish had no more injuries reported than the remainder.
Observed Murray cod size distribution in catch
Of the Murray cod caught and measured (n=309) by interviewed anglers during the survey periods, 132 were captured where a 50 cm legal minimum length limit (LML) was legislated (during 2006– 07 season, or during the 2007–08 season on the Loddon River); and 177 were captured where a 55 cm LML was legislated (during the 2007–08 season from the Murray) (Figure 12). Most Murray cod lengths recorded came from along the Murray River fishery where the majority of interviews were obtained (Figure 13). There is a notable variation in the size-structure of the catches from individual reaches with the lower Murray River reach (reach 5) producing fewer small fish and more medium and large fish than the more upstream reaches of the Murray River (reaches 4 and 1).
Across both fishing seasons 77% of Murray cod measured by anglers were smaller than an applicable 50 cm LML; or 93% were smaller than an applicable 55 cm LML. While the total release-rate is generally high (Table 9), this is due to the majority of fish caught being smaller than the LML. Throughout the study across all fisheries studied, under a 50 cm LML the voluntary release rate i.e. the proportion of legally-harvestable fish released by anglers voluntarily, was 30% whereas during 2007–08, under a 55 cm LML the voluntary release-rate was 25%. Total and voluntary release rates are highly variable across the range of fisheries studied (Table 9).
Given the variable LML legislated across the duration and geographic extent of this study, a meaningful examination of trends in catches of Murray cod larger than LML, is difficult. To allow a consistent comparisons of a LML 'indicator' for future evaluation, the total number caught in each study reach larger than 60 cm is included in Table 9. Sixty centimetres is the new LML for Victoria and NSW in 2009, making these States consistent with Queensland legislation. This indicator was highest in the Loddon River (16.7%) and lowest in the Ovens and Goulburn rivers (0.0%).
Table 9. Catch and release statistics for the individual study reaches under the two legal minimum lengths (LML) that were legislated during the study. During 2006-07 a 50-cm LML applied in all waters. In NSW waters this was raised to 55 cm in 2007-08. Total release rate is the percentage of the total catch that was released by anglers. Voluntary release rate is the percentage of Murray cod ≥ the LML that were released by anglers. As of March 2009 Vic, NSW and Qld now all have a 60 cm LML and the percentage of Murray cod caught ≥ 60 cm is included as a 'benchmark' to assess future changes in size-distribution.
| Study reach | LML applied (cm) | Total release rate (%) | Voluntary release rate (%) | Total caught >60 cm (%) |
|---|---|---|---|---|
| Lower Goulburn River | 50 | 63 | 14 | 0.0 |
| Lower Ovens River | 50 | 100 | 1002 | 0.0 |
| Loddon River | 50 | 67 | 0 | 16.7 |
| Murray River (Yarrawonga to Torrumbarry) | 50 | 88 | 32 | 6.6 |
| Murray River (Toolybuc to Torrumbarry) | 55 | 95 | 0 | 1.2 |
| Murray River (SA to Toolybuc) | 55 | 91 | 30 | 6.3 |
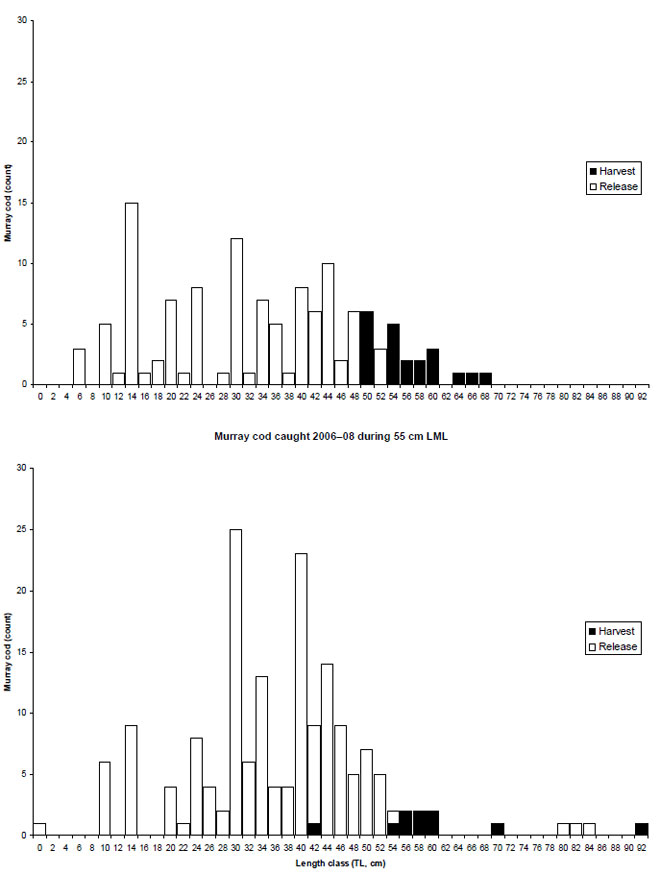
Figure 12. Frequency counts of lengths of Murray cod measured by anglers that were interviewed on the Murray River and Victorian tributaries 2006–08 under a 50 cm LML (n=132)(upper panel)and a 55 cm LML (n=177)(lower panel). Fish that were harvested (solid bars) and released (open bars) are shown separately.
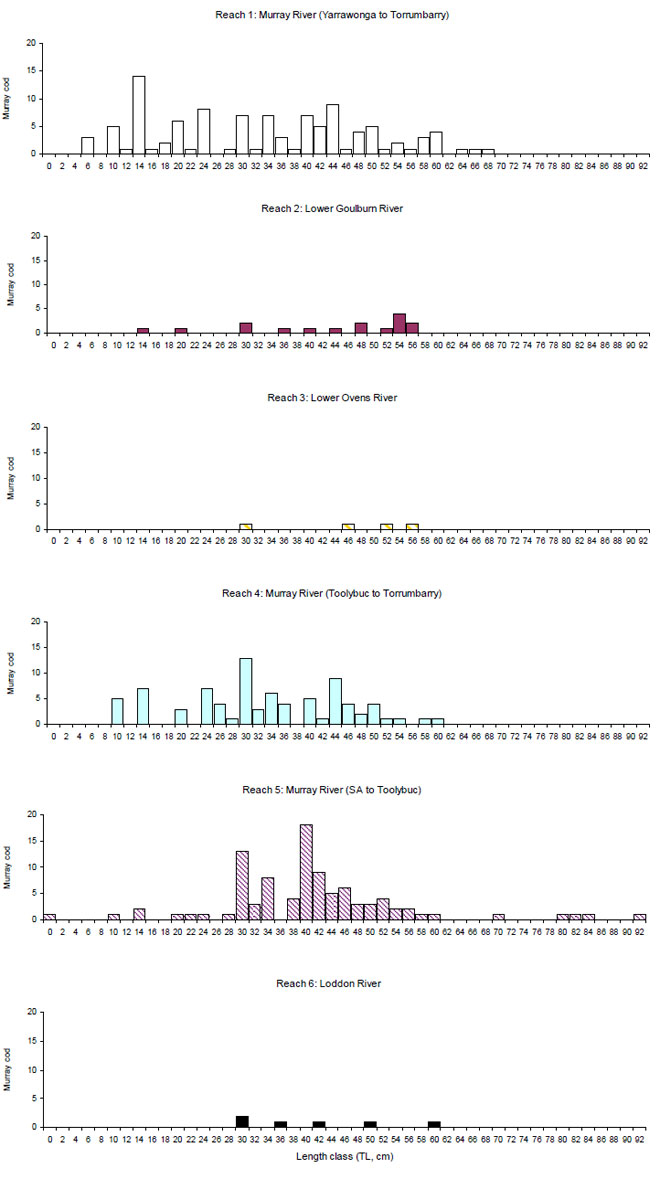
Figure 13. Frequency count of lengths of Murray cod measured by anglers 2006–08 in six study reaches
Recalled catch rate: Comparison of 'last trip' with present data collected at interview
Anglers that had fished in the fishery prior to the present interview were asked to recall their last trip to the fishery where they were interviewed. The timing of this last trip varied from 'earlier that day' (i.e. before the interview shift started) to possibly 'months ago.' However, the majority of responses would have related to 'last trips' that were several hours to a couple of weeks prior to interview. Anglers were asked to estimate how many hours they fished for and how many Murray cod they captured, and how many they harvested. Catch rates and harvest rates (Murray cod per hour) were calculated for each response and compared to those given for the present trip during interview.
The correlation between catch rates on the previous trip with present catch rates was statistically significant (n=747, c=0.22) with a significant linear regression of CPUE(present trip) on CPUE(last trip) (F=6.5, d.f.=1, p=0.01), suggesting that the general trend was for angler catch rates to be consistent. However, the previous-trip recalled data had lower frequency of zero catch-rates and higher frequency of non-zero catch rates than the present trip data (Figure 14). This recall bias inflated the reported average catch rate by over 400% and the harvest rate by over 150% for recalled previous trips (Figure 15).
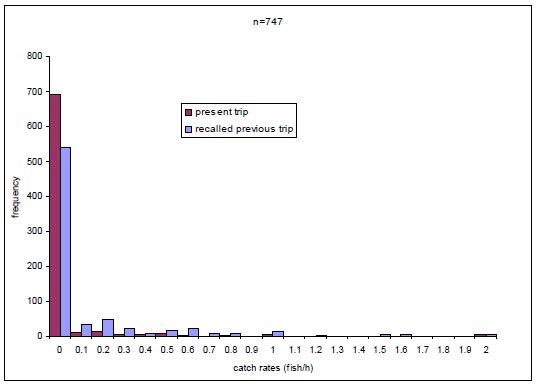
Figure 14. Frequency distribution of Murray cod catch rates (fish/h) for recalled previous trip and present trip. NB recalled previous trip catch rates data is truncated at 2.0 for comparative-clarity, maximum values included 4.1 fish/h.
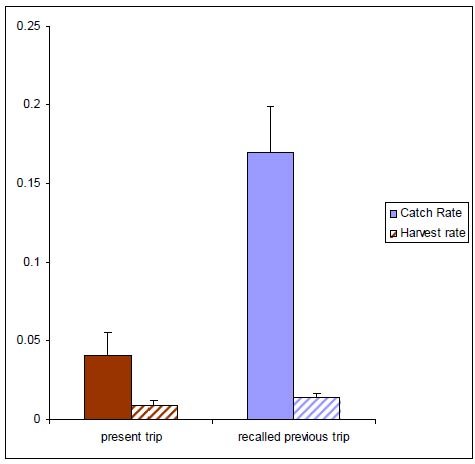
Figure 15 Comparison of Murray cod average catch rates and harvest rates (fish/h) collected during face-to-face interview for present trip, and their recalled previous trip for a random sample of 747 anglers fishing in the River Murray, and Goulburn, Ovens and Loddon rivers.
Discussion
The present study completes two years of angler surveys in Murray cod fisheries that are important for Victorian recreational fishers. It provides estimates of the total quantity of fishing effort, and catch that are attributable to reach-specific areas on the Murray River, Goulburn River, Ovens River and Loddon River. This is the first catch data for these fisheries since they were included within the diary-assisted phone survey conducted in 2000 about the fishing events of the 1998 and 1999 Murray cod seasons (Henry and Lyle 2003; Park et al. 2004). In addition to total fishery statistics on catch and retained-catch (i.e. harvest), the present study shows that in a nine month open season a hypothetical 'representative hectare' of river yields from 2 to 13 Murray cod as a recreational catch and less than two (0–1.5) Murray cod are harvested from the same hectare. Presenting such catch data on a 'per-area' basis facilitates comparison with population-density estimates that can be made in measured-areas using typical fisheries-science methods such as mark-and-recapture experiments, and depletion methods. Through such comparisons of recreational catch and population density it is possible to address questions of fishery sustainability, particularly when such figures are used in predictive mathematical models of the population and its fishery.
The statistically random sampling in both time and space used in this research means that the resulting estimates of catch and effort are representative of the whole fishery on these river reaches during the period of study. The sampling design also ensured that the comprehensive dataset of observations of angler-behaviour reflected an unbiased 'picture' of how the fishery is conducted. The contemporary angling literature is full of articles by anglers promoting (mainly) lure-fishing and more-often than not advocating the voluntary release of Murray cod (Ainsworth 2008; Mackenzie 2008; Clark 2009). Fishing tournaments across the Murray-Darling Basin are almost exclusively run as 'live-release' events3. An observer would perhaps assume that catchand-release plays a big role in the effects of fishing on Murray cod stocks. Our data shows that while a large proportion of the catch is released, the majority are released because they are smaller
Trends in other fisheries (e.g. largemouth bass in the USA, (Allen et al. 2008)) suggest that voluntary release rate may increase through changing socio-ethical behaviours and reducing pressures to provide food through recreational fishing. Increases in voluntary release rate have the capacity to reduce overall mortality rate, but also reduce the power of length-based limits to achieve increased sustainability (Allen et al. 2008). While increased ethical behaviour of anglers towards voluntary release is likely to reduce overall fishing-mortality, such increases may be balanced by legislating for increased LML which exposes a smaller proportion of the size-structure in the population to the choice of release or harvest. This balance may in-turn be influenced by increases to LML that allow more cod in the population to grow to a size when the ethical choice must be made. The complexity of the processes and possible outcomes of just two of the parameters involved in Murray cod population biology and management (eg. release rate and legal minimum length) is an illustration of why well constructed population models are invaluable to evaluate possible management decisions (Allen et al. 2009).
The Murray cod population models presently available (Todd et al. 2005; Allen et al. 2009) are all simulations based on our biological understanding of the species, and then 'tuned' to reflect limited observations about length frequency in the population (Todd et al. 2005; Allen et al. 2009) and recreational catch and harvest (Allen et al. 2009). Quantitative observations of catch and harvest are therefore important to provide checks on suitability of model-simulations. Our understanding of Murray cod biology and ecology is conceptually advanced (Lintermans and Phillips 2005; Rowland 2005), yet the present understanding of the quantitative relationships between recruitment of Murray cod and environmental factors (for example flows and habitat complexity) is rudimentary and insufficient to build accurate predictive models of Murray cod abundance. Repeating observations of catch and effort like those in the present study, over time will eventually enable the fitting of more traditional predictive models of population abundance with which to recommend and evaluate management decisions. Some things are difficult, like determining the nature of the environmental drivers for Murray cod production, and estimating how many Murray cod are in a population. Some things are easier, like estimating the amount of effort in the fishery and the level and nature of the catch and harvest. The former are useful to know but harder to manage; the latter are also useful, perhaps easier to achieve and more directly amenable to control by fisheries management policy.
The Murray Darling Basin Commission's Native Fish Management Strategy has a target to rebuild native fish stocks (including Murray cod) from 10% (in 2003) to 60% of pre-settlement abundance over 50 years (MDBC 2004). As such, the present estimates of catch for Murray cod and a range of other species, together with fishing-effort in the fishery, will form a useful fishery-dependant benchmark for assessment of the future level of recovery.
Released Murray Cod: some Considerations and implications
Murray cod were the most abundant species caught in all three study reaches. The Murray cod fisheries predominantly comprise immature fish that are smaller than the relevant LML (50, 55 or 60cm). Across all fisheries surveyed, around 60– 100% of the observed Murray cod catch was returned because they were less than the legel minimum length <LML or returned due to ethical considerations by the anglers. Measurement of the survival rate of these released fish has begun (Hall et al. 2008; Douglas et al. in prep.), and this work is likely to play a significant role in determining the level of sustainability of the present fishery.
The high observed release rate (c.f. harvest rate) suggests that post-release survival rate may be important to overall mortality rate, and that the mandatory release of fish smaller than the LML may contribute the most to this component of mortality. Post-release survival of large numbers of small, immature fish has long been recognised as highly valuable to the sustainability of fish populations (Waters and Huntsman 1986; Allen et al. 2008). A similar high release rate (77%) was observed for Murray cod from the whole Murray-Darling Basin during the 1998 and part of the 1999 fishing seasons (Henry and Lyle 2003; Park et al. 2004) although that survey gave no indication of the reasons for release.
Understanding factors influencing post-release survival is important in fisheries with high release-rates. These factors can include bait-type (artificial vs. natural), hook-type (number, size and style), hook-wound location and fish-size and fish-handling behaviour (Muoneke and Childress 1994; Infofish 2007).
Most cod were hooked in a shallow position within the mouth, or indeed outside the mouth itself. This may be due to the tendency for hooks to be set during the 'smash-and-grab' nature of the bite. While Murray cod biting gently are encountered; a violent bite and immediate hook-set is the norm. Most of the literature on post-released survival of angler-caught fish suggests that hook placement is a key factor influencing survival chances (Muoneke and Childress 1994). Survival is generally good for shallow hooked individuals in many fish species (Muoneke and Childress 1994). Experimentally determined released-survival rates for both shallow and deep-hooked fish (Douglas et al. in prep.) should be applied within Murray cod population models by using the finding that 71% and 29% of fish caught in the fishery are shallow-hooked and deep-hooked, respectively.
Bait used on single-hooks is by far the most popular and successful method used in the recreational Murray cod fishery along the Murray River and its Victorian tributaries. Baits such as cheese and shrimp are popular and yet they tend to select relatively small Murray cod compared to lures used in the fishery. As most lures used were ~6–15 cm in size (reconstructed from the hook-sizes recorded), this is consistent with the diet study of Ebner (2006) who showed that in the gut contents of large Murray cod (i.e. >50 cm, TL, and sampled by anglers), fish and decapod-crustaceans up to 15 cm long were the norm.
The use of small to medium sized hooks is popular yet in this fishery they increase the risk of deep-hooking for many Murray cod caught. The reason for the popularity of small hooks is unknown. Anglers may choose to fish with small hooks because:
- of the need to match hook-size to a preferred small bait size (e.g. live shrimp, Macrobrachium sp.)
- they are targeting of other species (eg. golden perch) or a perception that smaller hooks increase the likelihood of a by-catch of other species (eg. golden perch) while also allowing Murray cod to be 'targeted'
- the relative-abundance of small Murray cod is known and anglers wish to catch them, even though they must release them.
It may be useful to consider the question: Do large hooks limit the by-catch of small fish? While we observed a slightly greater proportion of fish >LML caught on large hooks; so-few anglers chose to fish with large single hooks that there was little confidence in the data to support the idea that big hooks select big fish. Murray cod have mouths with a large gape relative to their body-size; a 60 cm Murray cod has a gape of ~8 cm (Ebner 2006), easily accommodating hooks of size 10/0 and larger. Yet the most popular hook sizes in the fishery were small (<5/0). In other fisheries, small hooks have been shown to be effective and less damaging in species such as carp, (Rapp et al. 2008), and tropical reef fish (Mapleston et al. 2008). The diet of Murray cod >50 cm (TL) is mainly large fish and crustaceans (Ebner 2006). Given these dietary preferences, selection of bait by size should be expected for Murray cod and larger baits should lead to capture of fewer Murray cod that are smaller than the LML. However, large baits would generally require large hooks and there could be a trade-off between large hooks minimising deep-hooking, and small hooks causing reduced damage. Experimental evaluation of this trade-off may be warranted before one or the other is advocated.
UPTAKE OF 'BEST PRACTICE' FOR RELEASED-FISH SURVIVAL
The National Strategy for the Survival of Released Line Caught Fish4 is an initiative of the Fisheries Research and Development Corporation in conjunction with the Australian National Sportfishing Association and Recfish Australia. The strategy aims to increase the survival rates of released line caught fish and improve anglers understanding of the benefits of doing so. The National Strategy promotes best practice for releasing fish including minimising hook damage by using circle hooks, or "using a larger hook size than normal to reduce the chances of gut hooking and catching undersized fish"; using fish friendly equipment such as long-nosed pliers to remove hooks from shallow-hooked fish; cutting the line outside the mouth for deep-hooked fish and using knotless landing nets and fish-grips to land fish.
Compliance of anglers with the current best practice for handling and release of fish is low in the Murray cod fishery along the Murray River and its Victorian tributaries. Just over a third of Murray cod were landed with a net; this included knotted as well as knotless mesh. Knotted mesh nets have been shown to be more harmful to fish than the knot-less kind (Barthel et al. 2003). The majority were landed 'by hand' that included lifting small fish out of the water by the rod and line. Jaw clamping 'fish-grip' devices were also uncommon and only 1% of our recorded Murray cod captures were released after being unhooked in the water. Two-thirds of the fish that were deep-hooked were likely to be unhooked by hand, or using an instrument, rather than the best-practice of leaving the hook and cutting the line close to the jaw.
Fisheries and conservation agencies and representatives of the recreational fishing industry may need to do more to advocate and promote 'best practice' behaviours amongst anglers in the Murray cod fishery.
By-catch of Fish Species other than Murray Cod
Although the survey primarily sought information about the Murray cod fishery, catch data was collected for all species. Carp are not a preferred target species of most recreational anglers, and yet we estimate that anglers removed over 74 tonnes (conservatively assuming each carp had an average weight >=1 kg) in the 1074 km of the Murray River and 502 km of the Victorian tributaries studied over two 9-months fishing seasons.
The catch of other important recreational species such as golden perch was estimated, although the fishery was significantly smaller than that for Murray cod. Golden perch were only abundant enough in catches to approach the Murray cod catch in the reach 5 (Murray adjacent to SA border) and in the Ovens River (where catches of cod were relatively small).
Threatened species, such as trout cod and silver perch were also relatively abundant in the catch and were present in similar numbers to pest fish species such as common carp. Anglers reported catching trout cod in the Murray River downstream as far as Cape Horn near the mouth of the Goulburn River (35.074 S, 144.853 S) which is significantly further downstream than the limit commonly known for this species (McKinnon 1993). As by-catch of the recreational fishery, the catch abundance of carp, trout cod and silver perch may represent an excellent tool for monitoring abundance of these species without imposing any additional sampling stress on the stocks (of trout cod and silver perch) from additional fishery-independent surveys, such as electrofishing.
Some Methodological Considerations – Constraints and Limitations
ACCURACY OF ESTIMATES: RANGE CHECKING WITH EXISTING DATA
Many creel surveys in other Victorian fisheries have estimated the total effort within a fishery in angler-hours or an equivalent unit (Douglas and Hall 2004; Brown and Gason 2007); however, few if any, published studies have used an equivalent of the 'searched-area' method described in the present study. With a basic sharing of the estimated effort across the water-area of other fisheries it is possible to look comparably at the annual effort estimates available for a range of large Australian recreational fisheries tabulated in Bucher (2006) (Table 10). The present study's estimates of the density of fishing effort (58–251 angler-hours/Ha) are comparable with those of large to moderate sized east-coast estuaries.
Table 10. A comparison of effort, area, effort per hectare for a range of Australian east-coast estuarine, multi-species, recreational fisheries tabulated after Bucher (2006)
| Estuary | Water Area (Ha) | Annual Effort (angler-hours) | Effort density Angler-hours/hectare | Source |
|---|---|---|---|---|
| Lake Macquarie | 125500 | 970480 | 77 | Steffe and Chapman |
| (2003) | ||||
| Clarence River | 8924 | 709395 | 80 | Steffe et al.(1996) |
| Port Jackson | 4967 | 836950 | 169 | Henry (1984) |
| Manning River | 2335 | 144892 | 62 | Bucher (2006) |
| Richmond River | 1907 | 390240 | 205 | Steffe et al.(1996) |
| Tweed River | 1792 | 557413 | 311 | Steffe et al.(1996) |
| Brunswick River | 222 | 127200 | 573 | Steffe et al.(1996) |
| Wooli River | 190 | 60963 | 321 | Steffe et al.(1996) |
| Sandon River | 141 | 16602 | 118 | Steffe et al.(1996) |
| Mooball Creek | 40 | 28538 | 713 | Steffe et al.(1996) |
If we assume that annual effort varies little during the first and second years of the present study, then we can combine our estimates spanning two separate years in none-overlapping locations and conclude that together our six survey-reaches are equivalent to the annual effort for the same geographic area. The combined total effort in the present study was 1.9 million angler-hours. This seems broadly consistent with the National Recreational and Indigenous Fishing Survey (NRIFS) in 2000-01 (Henry and Lyle 2003), that provided estimates of the fishing effort from 12 months spanning the 1998 and 1999 Murray cod fishing season by State. For Victoria and NSW, 2.3 million hours and 3.8 million hours of line fishing (all species) was estimated for 'rivers' (6.1 million hours for both States). Our present estimate is therefore equivalent to slightly less than a third of all the fishing effort expended in 'rivers' in NSW and Victoria during the NRIFS (Henry and Lyle 2003). It should be noted that the NRIFS estimate included fishing in all rivers, and would contain a large component of trout fishing in cold-water streams, the Darling River and other large Murray-Darling basin tributaries, and fishing in coastal streams outside the range of Murray cod.
Catch and harvest estimates from the present study from a small proportion of the whole MDB are broadly comparable with the Murray-Darling Basin estimates overall (Henry and Lyle 2003; Park et al. 2004). Total catch estimates for Murray cod in 2006-08 from the present study of around 54% of the length of the Murray fishery (1074 km out of 1986 km of River Murray up to Yarrawonga) plus 502 km of three Victorian tributaries, are equivalent of around 22% of that estimated for the whole MDB in 1998–99. For the retained component of the catch, total harvest estimates in the present study are only equivalent to approximately 8% of the harvest estimated for the Murray-Darling Basin in 1998–99. As a proportion of the total catch, the present estimate of harvest was much smaller (just over three times) what it was estimated to be in 1998–99 (Park et al. 2004). This could be due to the total release rates in the present study being generally higher (than previously observed. The present day 'climate' of higher LMLs may have contributed to this, making it harder for anglers to catch a legally-harvestable fish. However, the lack of data on length structure of the catch in 1998–98 makes further analysis of this a moot point, and highlights the importance of collecting data on catch length-structure into the future.
PRECISION: REPEATABLITY FOR FUTURE COMPARISSONS
The coefficient of variation (CV) is an accepted statistical standard method for measuring the precision, or repeatability of an estimate (Pollock et al. 1994). Each of the estimates in the present study can be considered as 'averages' and are given with a standard 'margin for error', or standard error (SE). The estimates are reported as an average, plus or minus an expected limit. The CV is really a way of expressing the standard error as a percentage of the estimate itself.
In the present study, CV for fishing effort and catch are low, indicating relatively precise estimates have been obtained. The precision of effort and catch estimates in the present study are comparable with those in NRIFS (Henry and Lyle 2003). The National survey reported less precision in some of its harvest estimates (28% for Vic, and 59% for SA) (Henry and Lyle 2003), and that pattern is also repeated here in this study.
The target for precision (10-30%) was far exceeded in most cases for effort and catch estimates in most fisheries, although precision of harvest estimates was poor probably due to the relatively low harvest rates estimated for most fisheries.
SURVEYING A WIDESPREAD FISHERY WITH DIFFUSE ACCESS
The innovative use of hand-held GPS (global positioning system) to track survey-effort enabled replicate spatial sub-sampling of angling activity on large study-reaches (100's kms). Previous on-site, roving creel surveys have required the 'whole area of interest" to be patrolled (Brown and Gason 2007) to develop 'daily' estimates of average catch and effort for the fishery, as described by Robson (1991). The 'standard' assumption is that the average catch and effort at these times surveyed is representative of all the similar times in the season and is weighted-up accordingly. The present study modifies these calculations such that average catch and effort are calculated for a variable spatial-sample of the fishery, as well as a temporal one. The extra assumption here is that average catch and effort in our spatial-sample is representative of the rest of the study-reach at that time, and this is again weighted-up accordingly. Both of these assumptions can be tested by examining the temporal and spatial variation in catch-rates from interviews; however, this analysis is yet to be completed.
THE ONE(S) THAT GOT AWAY
With random sampling of the fishery at the level undertaken in the present study we were able to observe captures of many Murray cod up to 92 cm TL. While it is certain that larger individual cod were captured by anglers within the reaches surveyed during the study (e.g. see MacKenzie (2008), and other similar magazine articles by same author), their capture was not observed (i.e. not caught during the creel sessions by any anglers interviewed). This indicates the relative and overall rarity of such captures. The majority of anglers are not truly 'targeting' these large fish. Informal observations made during the surveys support this idea as the tackle used by most fishers is inappropriate to successfully hook and land large (>20 kg), muscular fish, living in complex snaggy-habitat (e.g. <15 kg breaking strain line, small bait-size, small hook-size, light line-class rods, etc). The large fish reported in the angling media are mainly caught by a minority of specialists. Presumably, with increased survey-sampling intensity (i.e. sampling a larger proportion of the anglers fishing a greater proportion of the season) we would encounter and interview more of these specialists and be able to observe and record these rare captures, but at much greater survey-cost. It is doubtful whether the trade-off in benefit of observing these rare captures would be worthwhile in greatly improving accuracy or precision our estimates of catch abundance. However, the addition of a small number of large individuals to the record may have a greater impact in assumptions about biomass. For example, the average weight of Murray cod from the present data set (not presented) probably under-represents that of the true fishery.
THE 'BIG DRY'
For large parts of southern and eastern Australia, dry conditions have now persisted since October 1996. For some areas, the accumulated total rainfall deficit over this period now exceeds a full year's normal rain. For the Murray-Darling Basin, however, the present study took place in the sixth year of lower than average rainfall totals (Australian Bureau of Meteorology, Special Statement No. 14. Issued 1 November 2007 by the National Climate Centre.)
The Ovens River is an unregulated stream. The catchment has no water-storage capacity and the summer of 2006-07 saw several months with zero-flows downstream of Everton and Wangaratta. This extreme dry period for the Murray-Darling Basin was also been accompanied by high temperatures, causing higher evaporation rates that exacerbated the low rainfall. Both daytime maximum and daily mean temperatures for the six years from November 2001 to October 2007 surpassed the previous records by a considerable margin. Faced with these conditions the Ovens River dried down to a series of disconnected pools for much of its length, while some flows from irrigation supply-storage kept the nearby Murray River and Goulburn River flowing. In contrast to the two flowing streams, as the season progressed, anglers became hard to find along the Ovens River. The recreational fishing persisted at a low level largely in the backed-up waters of the Murray River near Bundalong but most of the effort was lifted voluntarily from the drought-stressed stream. Water-quality declined along the Ovens but there was no evidence of substantial fish-kills. The present study should not be considered as representative of a typical year for the Ovens River. Rather, it is an example of the recreational fishery that occurred during an extreme period of drought-stress on the river and its natural resources.
ONSITE VS. OFF-SITE SURVEYS
Estimates from the present study using onsite surveys have lower potential for sampling, response and non-response errors than off-site surveys (Pollock et al. 1994) and allowed subtle details about angler behaviour to be recalled and recorded in relation to each Murray cod caught. This was an important design consideration since an objective of the work was to collect data on angler-behaviour factors that may be important in regulating the survival of released fish. Accurate recall of fish-size, hook-size, hook location, landing and handling methods and injury observations was important for all the Murray cod caught, including the 'less-memorable' small ones. Previous fishery estimates using diary assisted recall and telephone survey were made over broader, specific geographic 'ABS statistical divisions' (Henry and Lyle 2003). As people residing in many statistical divisions converged to fish in each particular fishery (e.g. the Murray River) it is difficult to make fishery-specific conclusions from NRIFS data. A 'management unit' approach suggested as appropriate by recent genetic research (Ingram et al. 2005; Rourke et al. 2006), and discussed at recent research and management fora, will likely require information on the sustainability of particular fisheries (i.e. river reaches) (Lintermans and Phillips 2005).
For alternative survey methods, such as mail or telephone surveys using the existing angling licence databases (in NSW and Victoria) as a sampling frame (i.e. a list of the names and addresses of fishers who may take part in the Murray cod fishery), the under coverage rate (Pollock et al. 1994) of the sample would be 22%–37% due to the level of anglers fishing who are actually exempt from owning a licence. Without a recreational fishing licence that is compulsory for all (even if fee-free for some), there is an unfortunate and significant gap in an otherwise adequate sampling-frame. Anglers exempt from an RFL (i.e. juniors, seniors, etc) perform differently showing lower catch-rates for Murray cod than anglers requiring RFL, so if an RFL database is used as a sampling-frame, the consequences of this under coverage would present as bias in the catch estimates. Under coverage cannot be compensated for by assuming that exempt anglers are similar to non-exempt ones. It is likely that differing catch-rates observed between RFL-holders and those exempt are also a consequence of different behaviours and ignoring this would result in a range of unknown biases in evaluation of social and economic factors in creel survey samples based on any existing RFL database as a sampling-frame.
Angler Recall Bias
All of the data collected at interview was of recalled-events. The catch data recalled for a short period of up to five hours during the interview (the maximum length of an interview session), is here regarded as un-biased and as real-time data on catch and effort. In truth, some bias may be expected even over this short period of time, and mis-information about catch or effort was probably included as it was either accidentally or deliberately supplied. This data is compared with data recalled over periods of longer duration from the anglers 'last trip' to the same fishery and so the real-time, or short-term bias is likely negligible in comparison.
Many of the anglers' last trips were very recent (e.g. several hours earlier that same day) although some were up to many months prior to interview. With hindsight, the survey questionnaire should have identified, the date of the 'last trip' so that the duration of recall and its effect on bias, could have been evaluated. Nevertheless, the time and location of a previous recalled trip, should be just as 'random a sample' of fishing activity as the trips sampled during creel interviews; and therefore just as representative of the season's fishing activity.
If anglers recalled perfectly the number of fish, and the time-spent-fishing, the frequency distribution of recalled-catch rates should be no different to the distribution of catch-rates at interview. However, the data showed that anglers tended to under-report zero catch rates, and over-report non-zero catch rates such that the overall recalled catch-rate was vastly inflated compared to the rate estimated for the interview session. Whether this is deliberate or simply indicative of failing memory is immaterial.
Based on angler avidity data reported, it would seem that the skill and experience varies widely among the anglers in these fisheries as it does in many others (Douglas 2005; Brown and Gason 2007). Catch rates of anglers during the interview session were correlated with catch rates during their last recalled trip. That is, anglers with high catch rates during interview tended to also have high catch rates on previously recalled trips and conversely; those with low catch rates 'now' tended to have low catch rates 'last time'. So the assumption that angler's skill-levels in the fishery remain stable on a timescale relevant to their recollections seems valid.
Recalled catch rates are an unreliable indicator of actual catch rate even for Murray cod which may be considered a 'high-value, memorable' species. Other studies have shown that bias in recalling participation levels (i.e. effort) is common, and frequently varies with avidity of the anglers; with more avid anglers overestimating their participation in the fishery (Connelly and Brown 1995). This is of concern for the designers of any off-site angler surveys designed to estimate catch, effort or catch-rate. Previous research has used comparisons of diary vs. mail-back surveys to show that duration of recall is correlated with overestimation of effort (Tarrant et al. 1993; Connelly and Brown 1995) however; few have evaluated recall bias using real-time data and previous-trip data from on-site surveys. Anglers exaggeration of catch-rates is a well-known phenomenon both anecdotally and in research publications (Sullivan 2003). The present study shows that for Murray cod fisheries, unless catch and effort is recorded by anglers during, or immediately fishing activity is completed – recalled catch-rates will be overestimated. The use of diaries to assist accuracy of recall is probably beneficial, but unless the diaries are completed during fishing trips, they are unlikely to lead to unbiased estimates of catch-rate, catch or effort.
The degree of bias is likely to be related to the anglers avidity (Connelly and Brown 1995); as well as their actual catch-rate (Sullivan 2003).The present study did not record the duration of the recall period for each interview, but such data would be useful to determine the period over which anglers recollections of catch and effort can be used and with what level of bias. Further comparisons of self-reported catch rate from interviews, with actual-catch rates of trusted 'research anglers' may also be warranted to assess the minimum level of bias attainable at interview in the fishery.
Flow-on effects of South Australian Moratorium on fishing for Murray cod – assessing the shifting fishing-effort
In December 2008, coincidently at the end of data collection in the present study, the South Australian (SA) government announced a moratorium on fishing for Murray cod. From December 2009, until such a moratorium is lifted, residents of SA wishing to fish for Murray cod are likely to shift their attention to the NSW waters of the Murray River in nearby south-western NSW and north-western Victorian waterways. This shifting fishing effort will increase pressure on the resource of these streams.
Protected areas, have recently been advocated as a 'next step' in sustainable management of Murray cod stocks (Koehn 2005; Wahlquist 2009) as they have for other species and fisheries (Pauly et al. 2002).
The present study has 'benchmarked' the catch and fishing effort on a large reach of Murray River adjacent to the SA border (reach 6) during the season prior to the moratorium, and documented the proportion of fishers that were SA residents. This data puts management agencies in the position to gauge the effects of this de facto 'protected area' on neighbouring stocks. Potential positive effects to look for on the NSW or Victorian side of the border may include increased catches or shifts in size-structure of catches through recruitment and migration of Murray cod from the protected area in SA; and potential negative effects (on sustainabilityindicators) may include increased fishing effort and increased catches though local concentration of increased fishing effort adjacent to SA.
Conclusions
- The use of a stratified, random, roving creel survey was effective at sampling Murray cod catch, retained-catch and fishing-effort in large river reaches within the Murray-Darling River System. In two fishing seasons 2006– 08 nearly 1700 km of river reaches in the southern Murray-Darling River system were sampled and over 1400 angler interviews were completed. Representative data were collected from anglers about their catch, the time they had spent fishing and a range of angler-behaviours and fishing-practices.
- Most (85%) of anglers interviewed were Victorian residents. Along three reaches of the Murray River (in NSW) 76%–89% of anglers interviewed were Victorians, confirming previous findings that the NSW waters of the Murray River are extremely important to fishers who are Victorian residents.
- Reduction of the number of rods lines per angler to two may have had little effect in removing any fishing 'pressure' from Murray cod stocks. Anglers using from one to five rod-lines showed no difference in catch rates for Murray cod but anglers with two rods harvested (i.e. the retained catch) Murray cod at a greater rate than those with a single rod.
- Analysis of a subset of the interviews in 2006–07 on a study reach where set-lines were legal fishing gear, showed only a slightly higher (non-significant increase) catch rate for anglers using setlines. However, it is acknowledged that this research project was unable to measure the effect of the removal of large numbers of set-lines that were legal in much of the fishery prior to this study.
- At the level at which angler avidity6 was measured (three categories) there was no statistical difference in Murray cod catch or harvest rates. Avid anglers (eg. 'active' and 'regular') caught Murray cod at slightly higher, but statistically similar, rates to 'occasional' anglers. It seems likely that segmentation of anglers in the Murray cod fishery by their 'avidity' may require more categories, in order to see the expected trend of increased catch-rates with avidity.
- Although catches varied from reach-to-reach, and at a finer scale within reaches, the study shows that an 'average hectare' of river yields from 2 to 13 Murray cod as a recreational catch per season, and less than two (0–1.5) Murray cod are harvested per hectare.
- Bait used on single-hooks is by far the most popular and successful method used in the recreational Murray cod fishery along the Murray River and its Victorian tributaries. Cheese, shrimps and bardi grubs were the three most popular successful baits for Murray cod. In total these three baits accounted for 54% of the catch. Lures accounted for 13% of the Murray cod catch. Lure-caught Murray cod included proportionally more fish larger than the LML than fish caught on bait.
- Bait fishing anglers should use large hooks (> 5/0)
- o Most Murray cod were caught on relatively small hooks (relative to the gape of the fish) from size 1/0 to 4/0. Few anglers fished with hooks sized 5/0 or larger however, there was some evidence that anglers using such large hooks catch proportionally more fish larger than the present LML (60 cm, TL).
- o A third of Murray cod caught were deep-hooked. However, the probability of deep-hooking varied with fish-size and hook-size. Using large hooks (5/0 and larger) gives the bait-fishing angler the best chance of only shallow-hooking a Murray cod. As hook-size decreases and fish-size increases the chance of deep-hooking reaches a maximum. Due to the species' voracity and large mouth gape-size large hooks do not just catch large Murray cod; but any small cod caught when using a large hook are less likely to be deep-hooked.
- o Differential survival rates of some fish species by hook-size indicate that this should be experimentally investigated for Murray cod to determine if there is a trade-off with large hooks causing low survival when they are ingested
- Voluntary release rate (of fish larger than LML) is only moderate (14–32%) and to-date only contributes moderately to the sustainability of this fishery. The high overall release rate observed (70%), is mainly compulsory-release due to fish being smaller than the legal minimum length.
- Given the likely importance of the survival of small Murray cod, in the sustainability of this fishery, more should be done by all stakeholders to try and achieve practice-change to maximise survival of released fish. The uptake of 'best-practice' for released Murray cod survival in this fishery is presently poor. Use of nets or jaw-grippers to land fish is low. Hooks were most often removed from deep-hooked fish, instead of the recommended 'cutting the line close to the jaw and leaving the hook in the fish'.
- Evidence is presented to illustrate some of the difficulties of using alternative, off-site survey methods (e.g., diary assisted phone or mail surveys) to collect reliable catch and effort data from this Murray cod fishery.
- Anglers in the Murray cod fishery showed they were unable to accurately recall their catch and/or effort information over periods greater than the 5-hour interview shift duration. Beyond this duration, anglers consistently underestimated the frequency of zero-catches and overestimated the frequency of nonzero catches. This recall bias inflated the reported average catch rate by over 400% and the harvest rate by over 150% for recalled previous trips. This suggests that catch and effort data recorded off-site, will only be reliable if the recording is done (e.g. the diary completed, the phone-call survey completed) within 5-hours of starting fishing. Diaries or interviews completed on returning home, or later, will not be adequate.
- The RFL databases are presently a poor sampling-frame with which to draw samples of anglers for survey. Up to a third of anglers in the fishery are not represented in an RFL database. These anglers–exempt from owning an RFL, have different catch-rates for Murray cod and are likely to show a different range of behaviours (e.g. voluntary release, etc).
Recomendations
- The present study has laid some of the groundwork necessary to enable the future monitoring of fishing effort, catches and harvest and also the catch structure (size and species) in some of the southern Murray-Darling Basin's important Murray cod recreational fisheries. Periodic repetition of some or all of these surveys is recommended to establish a time-series of statistics on the recreational fishery that could be used to evaluate future management decisions, through the use of such data in quantitative Murray cod population models (Allen et al. 2009), and an adaptive management approach as advocated in recent Murray cod management workshops (Nicol et al. 2005).
- To enable evaluation of the sustainability of the recreational fishery, the present catch-density and harvest-density estimates should be viewed in the context of comparable population-density estimates from representative sites around the Murray-Darling Basin.
- Achieve practice-change to modify anglerbehaviour towards techniques that improve post-release survival. Increased and more effective efforts must be made to advocate 'best-practice' for improved released fish survival targeting anglers fishing for Murray cod. The present study acts as a bench-mark to evaluate levels of practice-change achieved in the future.
- Experimental examination of the potential trade-off between increasing damage from using large hooks; and of large-hooks reducing the incidence of deep-hooking, warrants investigation. Until this is complete, the recommendations made to anglers should be to "use large hooks for Murray cod to reduce the number of small fish being deep-hooked and increase your chances of catching one large enough to harvest."
- Effects of the South Australian moratorium on Murray cod fishing (commenced 2009) may have ramifications for cross-border fisheries (e.g. increasing effort). The present work is suitable as a benchmark for SA residents fishing NSW and Victorian waters. The SA moratorium may serve as a de facto 'protected area' for Murray cod and presents opportunities to study effects on adjoining fisheries, to increase understanding of potential role of protected areas in the sustainable management of Murray cod stocks.
- Further analysis of existing angler interview data at finer spatial scales than presented here may enable increased knowledge of the relationship between catch & effort and easeof-access for anglers informing public access managers about the level of Murray-cod protection/exploitation that caused by management of angler-access.
Acknowledgments
Thanks to department staff, Peter Mahy, Matthew Bayley, Colin Mansell, Ken Sloan, Chris Holyman, Russell Strongman, Neil Oakley, Duncan Hill, Bradley Tucker, and John Douglas who collected most of the data. Thanks to Anne Gason, for assisting me with the calculations. Thanks to Allister Coots, for the assistance with the spatial and geographic data. Thanks to James Andrews, Travis Dowling and Jon Presser, of the deaprtment for reviewing an earlier draft. A big thanks to all the recreational anglers who participated freely in the surveys.
This project is funded by the Victorian Government using Recreational Fishing Licence Fees.
References
Ainsworth, M. (2008). The Murray in Autumn Exploring The Deep. Freshwater Fishing Australia. 92.September/October p.48– 51
Allen, M. S., Brown, P., Douglas, J., Fulton, W., and Catalano, M. J. (2009). An assessment of recreational fishery harvest policies for Murray cod in southeast Australia. Fisheries Research 95, 260–267. doi:doi:10.1016/j.fishres.2008.09.028
Allen, M. S., Walters, C. J., and Myers, R. (2008). Temporal Trends in Largemouth Bass Mortality, with Fishery Implications. North American Journal of Fisheries Management 28, 418–427.
Barthel, B. L., Cooke, S. J., Suski, C. D., and Philipp, D. P. (2003). Effects of landing net mesh type on injury and mortality in a freshwater recreational fishery. Fisheries Research 63, 275-282.
Brown, P., and Gason, A. (2007). Goulburn River Trout Fishery: Estimates of Catch, Effort, Angler-satisfaction and Expenditure Fisheries Victoria Research Report No. 30, Melbourne.
Bucher, D. J. (2006). Spatial and Temporal Patterns of Recreational Angling Effort in a Warm-Temperate Australian Estuary. Geographical Research 44, 87
- doi:doi:10.1111/j.17455871.2006.00362.x Clark, M. (2009). The Red Eye Shift. Freshwater Fishing Australia. 96. p.24–26
Connelly, N. A., and Brown, T. L. (1995). Use of Angler Diaries to Examine Biases Associated with 12-Month Recall on Mail Questionnaires. Transactions of the American Fisheries Society 124, 413–
422.
Cooke, S. J., and Philipp, D. P. (2004). Behavior and mortality of caught-and-released bonefish (Albula spp.) in Bahamian waters with implications for a sustainable recreational fishery. Biological Conservation 118, 599-607.
Douglas, J. (2005). Rubicon River Trout Fishery Assessment. Fisheries Victoria, Melbourne.
Douglas, J., Brown, P., Hunt, T., Allen, M. S., and Rogers, M. W. (in prep.). Evaluating Relative Impacts of Recreational Fishing Harvest and Discard Mortality on Murray Cod (Maccullochella peelii peelii)
Douglas, J., and Hall, K. (2004). Lake Wendouree Fisheries Assessment. (former) Department of Primary Industries, 7, Snobs Creek.
Douglas, J., Strongman, R., and Giles, A. (2002). Lake Dartmouth Multi Species fishery Assessment.
Ebner, B. (2006). Murray cod an apex predator in the Murray River, Australia. Ecology of Freshwater Fish 15, 510–520.
Hall, K., Broadhurst, M., Butcher, P., Brand, C., and McGrath, S. (2008). Survival of Freshwater Fish After Catch-and-Release Angling. Freshwater Fishing Australia. May/June p.59-61
Henry, G. W., and Lyle, J. M. (Eds) (2003). 'The National Recreational and Indigenous Fishing Survey ' (NSW Fisheries: Cronulla, NSW.)
Hume, D. (1991). Report on three years of creel surveys: 1984 to 1987. Arthur Rylah Institute for Environmental Research, Department of Conservation & Environment, Technical Report series No. 122, Heidelberg.
Humphries, B. (2008). Catch time could be cod's puberty blues. Fish, Fisheries Research and Development Corporation News. 1.
p.33
Infofish (2007). Released Fish Survival Fact Sheet: Causes of Mortality (Fact sheet). InfoFish.
Ingram, B. A., Rourke, M. L., Lade, J., Taylor, A. C., and Boyd, P. (2005). Application of genetic and reproduction technologies to Murray cod for aquaculture and conservation. In 'Management of Murray cod in the Murray-Darling Basin. Statement, recommendations and supporting papers (Workshop held in Canberra, 3-4 June 2004)'. (Eds M. Lintermans and B. Phillips.) pp. 107
- (Murray-Darling Basin Commission: Canberra.)
Koehn, J. (2005). Threats to Murray cod. In 'Management of Murray Cod in the MDB, Statement, recommendations and supporting papers'. (Eds M. Lintermans and B. Phillips.) pp. 30–37. (Murray-Darling Basin Commission: Canberra.)
Lintermans, M., and Phillips, B. (2005). 'Management of Murray cod in the Murray-Darling Basin, Statement, Recommendations and Supporting Papers.' (Murray-Darlin Basin Commission and the Cooperative Centre for Freshwater Ecology: Canberra.)
Lyle, J. M., Coleman, A. P. M., West, L., Campbell, D., and Henry, G. W. (2002). New Large-Scale Survey Methods for Evaluating Sport Fisheries. In 'Recreational Fisheries: Ecological, Economic and Social Evaluation'. (Eds
T. J. Pitcher and Hollingsworth.C.E.) pp. 207–226. (Blackwell Science: Oxford, UK.)
Mackenzie, R. (2008). Big cod hot to trot. Victoria Fishing & Boating Monthly. July p.46
Mapleston, A., Welch, D., Begg, G. A., McLennan, M., Mayer, D., and Brown, I. (2008). Effect of changes in hook pattern and size on catch rate, hooking location, injury and bleeding for a number of tropical reef fish species. Fisheries Research 91, 203-211.
McKelleher, R. (2005). An outline of the threatened species listing process under the Environment Protection and Biodiversity Conservation Act 1999 (EPBC Act). In 'Management of Murray cod in the Murray-Darling Basin'. (Eds
M. Lintermans and B. Phillips.) pp. 62–
- (Murray-Darling Basin Cimmission and the Cooperative Research Centre for Freshwater Ecology: Canberra.)
McKinnon, L. J. (1993). A significant record of the endangered trout cod, Maccullochella macquariensis(Pisces:Percichthyidae) made during fish surveys of the Barmah Forest, Victoria. Victorian Naturalist 110(5), 186-190.
MDBC (2004). Native Fish Strategy for the Murray-Darling Basin 2003–2013. MDBC Publication No. 25/04, Murray-Darling Basin Commission.
Muoneke, M. I., and Childress, W. M. (1994). Hooking mortality: a review for recreational fisheries. Reviews in Fisheries Science 2, 123-156.
Nicol, S. J., Todd, C. R., Koehn, J., and Lieschke,
J. (2005). How can recreational angling regulations help meet the multiple objectives for the management of Murray cod populations? In 'Management of Murray Cod in the MDB, Statement, recommendations and supporting papers'. (Eds M. Lintermans and B. Phillips.) pp. 98–106. (Murray-Darling Basin Commission: Canberra.)
NMCRT (in prep 2008). National Recovery Plan for the Murray Cod Maccullochella peelii peelii (Mitchell, 1838) Draft. Department of Sustainability and Environment, Melbourne.
NMCRT (in prep 2008. ). National Recovery Plan for the Murray Cod Maccullochella peelii peelii (Mitchell, 1838) Draft. Department of Sustainability and Environment, Melbourne.
Park, T., Murphy, J., and Reid, D. (2004). The recreational fishery for Murray cod in the Murray-Darling Basin –Results from the National Recreational and Indigenous Fish Survey. In 'management of Murray Cod in the MDB'. (Eds M. Lintermans and B. Phillips.) pp. 93–97. (Murray-Darling Basin Commission: Canberra.)
Park, T., Murphy, J., and Reid, D. (2005). The recreational fishery for Murray cod in the Murray-Darling Basin –Results from the National Recreational and Indigenous Fish Survey. In 'management of Murray Cod in the MDB'. (Eds M. Lintermans and B. Phillips.) pp. 93–97. (Murray-Darling Basin Commission: Canberra.)
Pauly, D., Christensen, V., Guenette, S., Pitcher,
T. J., Sumaila, U. R., and Walters, C. J. (2002). Towards Sustainability in World Fisheries. Nature 418, 689–695.
Pollock, K. H., Jones, C. M., and Brown, T. L. (1994). 'Angler Survey Methods and their Applications in Fisheries Management.' (American Fisheries Society: Bethesda, Maryland.)
RACV (Ed.) (2000). 'VICROADS country street directory of Victoria.' 4 Edn. (Royal Automobile Club of Victoria: Melbourne.)
Rapp, T., Cooke, S. J., and Arlinghaus, R. (2008). Exploitation of specialised fisheries resources: The importance of hook size in recreational angling for large common carp (Cyprinus carpio L.). Fisheries Research94, 79-83.
Robson, D. S. (1991). The Roving Creel Survey.
American Fisheries Society Symposium
12, 19–24.
Rogers, M. W., Allen, M. S., Brown, P., Hunt, T., Fulton, W., and Ingram, B. (in prep.). Relative Value of Stock Enhancement versus Harvest Regulations for Fishery Sustainability. Canadian Journal of Fisheries and Aquatic Science
Rourke, M., Taylor, A., McPartlan, H., and Ingram, B. (2006). Genetic diversity in Murray cod (Maccullochella peelii peelii) across the Murray-Darling Basin. In 'Australian Society for Fish Biology 2006 Conference and Workshop on Cutting-edge Technologies in Fish and Fisheries Science. Abstracts and Official Program (Hobart, Tasmania, 28 August 1 September 2006)'. (Ed. ASFB.) p. 103.
Rowland, S. J. (2005). Overview of the history, fishery, biology and aquaculture of Murray cod (Maccullochella peelii peelii). In 'Management of Murray Cod in the MDB Statements, recommendations and supporting papers Proceedings of a Workshop 3--4 June 2004, Canberra'. (Eds M. Lintermans and
B. Phillips.) pp. 38–61. (Murray-Darling Basin Commission.)
Stoessel, D. (2008). Macalister River Creel Survey. (former) Department of Primary Industries, Fisheries Victoria Research Report No. 34, Melbourne.
Sullivan, M. G. (2003). Exageration of Walleye Catches by Alberta Anglers. North American Journal of Fisheries Management 23, 573–580.
Tarrant, M. A., Manfredo, M. J., Bayley, P. B., and Hess, R. (1993). Effects of Recall Bias and Nonresponse Bias on Self-Report Estmates of Angling Participation. North American Journal of Fisheries Management 13, 217–222.
Todd, C. R., Ryan, T., Nicol, S. J., and Bearlin, A.
R. (2005). The impact of cold water releases on the critical period of post-spawning survival and its implications for Murray cod (Maccullochella peelii peelii): a case study of the Mitta Mitta River, southeastern Australia. River Research and Applications 21, 10351052.
Wahlquist, A.(2009). Call to let cod off hook, 30 November 2009, The Australian. p.9 (News Limited: Canberra.)
Waters, J. R., and Huntsman, G. R. (1986). Incorporating Mortality from Catch and release into Yield-per-Recruit Analyses of Minimum-Size Limits. North American Journal of Fisheries Management 6, 463–471.
FootNotes
1 Areas surveyed in 2007–08 season were outside the known present-range of the trout cod
2 1 fish >LML caught and released, sample size too small
3 E.g. See
http://www.codclassic.com.au/html/other_compet itions.html, lists: "2008 Engel X-Mass Fish-A-Rama, 2009 Golden $$, 2009 Lowrance Da$h 4 Ca$h, 2009 His & Hers Partners Classic" as live release tournaments than the legal minimum length (LML). Amongst those larger fish that are legally harvestable, the voluntary release rate is still modest (<32%). It is perhaps important to note from this that presently the ethical choice of anglers to release fish (ie. voluntary release) is only having a modest effect mitigating harvest.
4 (http://www.infofish.net/releasefish/econtent.asp?lang=1&id=82)
6 Avidity – meaning, 'experience with and deeply knowledge of the fishery'