Recreational fishing survey 2009 - Report of overall results
DPI Fisheries Victoria
January 2010
![]()
Table of Contents
Introduction
Methodology
Questionnaire
Pilot test
Data collection
Data analysis
Sample profile
Total findings
Mean scores of all activities
Topic results
Overall importance
Differences between groups
Regional differences
Respondent age differences
Method of fishing differences
Other activities that could improve recreational fishing in Victoria
Improve boat facilities including ramps
Fish limits
Attachment: Web questionnaire
Introduction
DPI Fisheries Victoria engaged Australian Survey Research (ASR) to conduct a web survey of recreational fishing licence holders in Victoria during November 2009.
The survey's purpose was to gather fishers' views on their priorities for improving recreational fishing.
This report outlines the way in which the survey was conducted and key findings of the survey from a state-wide perspective. Results are also analysed by fishers' fishing locations, methods of fishing and age groups. A copy of the questionnaire used to collect feedback forms an attachment to the report.
Methodology
This section outlines how the questionnaire was developed and tested, how survey participants were identified and how the survey was administered and analysed.
Questionnaire
Fisheries Victoria project staff provided ASR with a preliminary set of questions. The questionnaire covered six topics of activities:
- Educating and informing people about recreational fishing
- Repairing where fish live
- Increasing the number of fish for recreational fishers to catch
- Studying recreational fish species and fishing
- Getting to fishing spots and providing fishing facilities
- Enforcing fishing rules.
In addition, a question about plastic fishing licences was included.
For respondents, the order in which topics appeared in the questionnaire was randomised so that each key topic was presented in a different order in equal amounts.
The web questionnaire was loaded into ASR's proprietary web surveying tool, Survey Manager, and hosted on ASR's internet servers located in a high security data centre in Melbourne's CBD.
Pilot test
ASR conducted a pilot test of 14 recreational fishers using volunteers supplied by two recreational fishing groups. Pilot participants were asked to complete the questionnaire on the internet. After completion, ASR individually telephoned each participant to seek feedback about the questionnaire wording, terms, question inclusion, instructions and navigation. As a result of the pilot feedback, parts of the data collection instrument were refined.
Data collection
Fisheries Victoria provided ASR with a list of 28,000 email addresses of people who applied for a recreational fishing licence online in the previous 12 months. Individualised email invitations were sent to the entire list. The survey was open for 13 days from 27 November to 10 December 2009. ASR tracked the response rate and one targeted reminder email was sent to non-responders.
Data analysis
Results have been analysed to produce mean scores (averages) and frequency distributions. ANOVA has been used to determine any statistical differences between demographic sub-groups. All tests are reported at the p<0.05 level (95% confidence level).
Means have been calculated using only the number of respondents who chose a rating point answer. In other words don't know, not applicable and no answers (blank) have been excluded from statistical calculations.
When interpreting statistical significance, caution must be taken when sub-groups have very different sizes. Large difference in sample sizes can affect the results of some statistical tests.
It is important to understand that statistically significant differences reflect underlying variations in scores rather than a difference in absolute amounts. For example, in some instances a difference of a tenth of a rating point in a mean score may be statistically significant, while a difference of a whole rating point between two mean scores may not be. So while some scores are quite different in absolute terms they may not be statistically significantly different.
The rating scale used to assess items is displayed in the table below. It is important to understand what the numbers represent because results are presented in numeric form only. For example, a mean (average) score of 4.0 indicates that, overall, the particular item is considered to be very important in improving recreational fishing.
| Rating Description | Value |
|---|---|
| Least important | 1 |
| Somewhat important | 2 |
| Important | 3 |
| Very important | 4 |
| Most important | 5 |
Sample profile
In total 4,411 people responded. ASR is not able to provide a response rate because it could not determine the number of people who received an invitation. While it sent 28,000 invitations, ASR could not assess how many email invitations actually arrived and at least 25% of email addresses bounced-back. Many people invitees sent out of office messages. However, only around 380 respondents are required for a sample to be statistically representative of a population of 20,000, so the size of response for this survey means that results can be interpreted with statistical confidence at the 95% confidence level and ±5% confidence interval. Far more people responded than required, so this survey is a very good view of people's opinions.
Representativeness of a sample is usually assessed at a 95% confidence level (accuracy) and a ±5% confidence interval (precision).
The confidence level tells you how sure you can be. It is expressed as a percentage and represents how often the true percentage of the population who would pick an answer lies within the confidence interval. The 95% confidence level means you can be 95% certain; the 99% confidence level means you can be 99% certain. Most researchers use the 95% confidence level.
The confidence interval is the plus-or-minus figure usually reported in newspaper or television opinion poll results. For example, if you use a confidence interval of 4 and 47% percent of your sample picks an answer you can be "sure" that if you had asked the question of the entire relevant population between 43% (47-4) and 51% (47+4) would have picked that answer.
Reference: www.surveysystem.com/sscalc.htm
In terms of demographics, respondents had the following profiles. The most common respondent was likely to be a non-indigenous male, of English-speaking background who fishes in the Port Phillip region for less than one day a month.
Total findings
This section outlines key findings by all respondents and all topics. Following this is a breakdown of results by key topics. For each item the mean score and frequency distribution has been presented.
When reading a frequency distribution chart it is useful to examine the spread or patterns of the coloured bars. More green on the chart means that respondents indicate that a particular item is more important. More red and orange means that a particular item is less important. If there is a mix of all colours it means that the opinions of respondents are split, with varying degrees of importance.
Note that in charts only data values of 3% or more have been labelled, even though they are displayed.
Mean scores of all activities
Respondents were asked to rate how important they thought an activity was for improving recreational fishing.
The table below presents the mean scores for all the rated items in the survey. The table has been sorted in descending order to display highest rating items at the top. The top score of 4.3 is equivalent to a rating of very important. The lowest score (2.7), is just under the important point on the rating scale. The majority of items rate around the very important level.
Scale: 1=Least important, 2= Somewhat important, 3=Important, 4=Very important, 5=Most important
| ITEM | MEAN |
|---|---|
| Helping to control pest fish species | 4.3 |
| Conducting research on how to rebuild populations of popular fish species that are reducing in numbers | 4.2 |
| Using new technology to detect illegal fishing | 4.1 |
| Repairing fish habitats such as re-planting near water and putting logs and other structures in waterways | 4.0 |
| Providing up-to-date information about good fishing practices and fishing rules like fish length stickers, signage and a fishing guide book | 4.0 |
| Stocking native fish in fresh water rivers and lakes | 3.9 |
| Deploying additional Fisheries Officer in mobile teams to monitor popular marine and inland fishing locations at peak times | 3.9 |
| Continuing the 13FISH Offence Reporting Service | 3.8 |
| Conducting research on how to do fish stocking better | 3.8 |
| Rebuilding populations of trout cod, Macquarie perch and fresh water catfish in selected fresh waterways | 3.7 |
| Understanding the biology of popular fish species and how these fish live and breed | 3.7 |
| Building new fishing reefs in bays and inlets to attract fish species | 3.7 |
| Helping charter fishing boat operators and fishing guides to use good fishing practices | 3.7 |
| Buying water to increase river flows and water levels in lakes for fish | 3.7 |
| Stocking species like prawns, black bream, estuary perch and mulloway in coastal bays and inlets | 3.7 |
| Stocking trout and other salmonid species in fresh water rivers and lakes | 3.6 |
| Developing environmentally friendly fishing gear and fishing practices | 3.6 |
| Building new fishing reefs in coastal waters | 3.6 |
| Understanding more about people who go fishing - finding out why people fish, what could make fishing better and what is important to them when they go fishing | 3.4 |
| Teaching primary school children about fish habitat and how to fish | 3.4 |
| Promoting recreational fishing as a healthy activity | 3.4 |
| Providing information and public equipment to improve fishing safety, such as life rings at popular rock fishing sites | 3.3 |
| Improving access to fishing locations for fishing boats and kayaks | 3.3 |
| Supporting Fishcare volunteers talk to fishers about good fishing practices | 3.2 |
| Providing beach or river access tracks and fence step overs | 3.2 |
| Running fishing clinics for children | 3.1 |
| Placing fish attracting buoys in coastal waters | 3.1 |
| Building fish cleaning tables and fishing platforms | 3.1 |
| Involving multi-cultural communities in recreational fishing | 3.0 |
| Providing maps and signs showing how to get to good fishing sites | 2.9 |
| Developing a new recreational fishery for barramundi in suitable waters (for example Hazelwood pondage) | 2.9 |
| Plastic licences | 2.7 |
Topic results
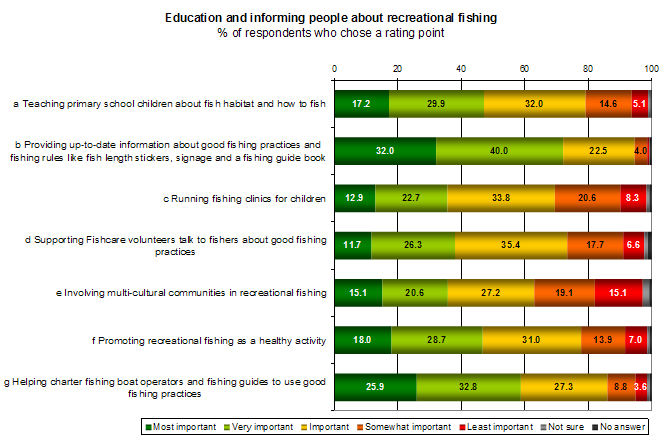
Educating and informing people about recreational fishing
Mean scores for this topic were varied. The highest and lowest scoring items have been bolded for easier reference. The highest scoring activity for this topic is one of the highest in the whole survey.
Scale: 1=Least important, 2= Somewhat important, 3=Important, 4=Very important, 5=Most important
The frequency distribution chart on the following page demonstrates that there were varied opinions across this topic. Over 70% of respondents indicated that it was very or most important to provide up-to-date information about good fishing practices and rules. Numbers in the chart represent the proportion of respondents that chose a rating point as their answer.
| ITEM | MEAN |
|---|---|
| a Teaching primary school children about fish habitat and how to fish | 3.4 |
| b Providing up-to-date information about good fishing practices and fishing rules like fish length stickers, signage and a fishing guide book | 4.0 |
| c Running fishing clinics for children | 3.1 |
| d Supporting Fishcare volunteers talk to fishers about good fishing practices | 3.2 |
| e Involving multi-cultural communities in recreational fishing | 3.0 |
| f Promoting recreational fishing as a healthy activity | 3.4 |
| g Helping charter fishing boat operators and fishing guides to use good fishing practices | 3.7 |
The frequency distribution chart on the following page demonstrates that there were varied opinions across this topic. Over 70% of respondents indicated that it was very or most important to provide up-to-date information about good fishing practices and rules. Numbers in the chart represent the proportion of respondents that chose a rating point as their answer.
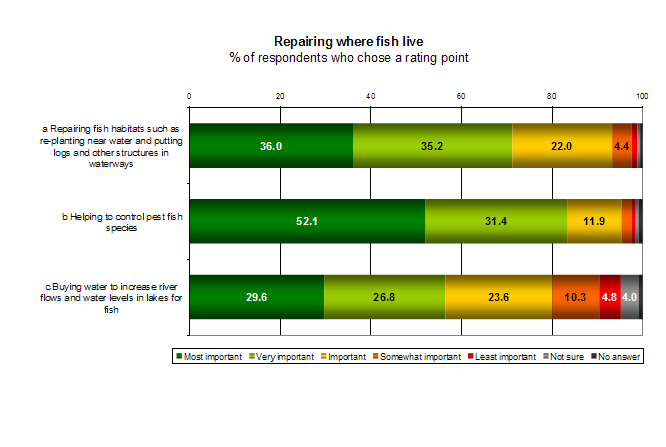
Repairing where fish live
When rounded, all items rated as very important. Item b is the highest rated item in the entire survey.
| ITEM | MEAN |
|---|---|
| a Repairing fish habitats such as re-planting near water and putting logs and other structures in waterways | 4.0 |
| b Helping to control pest fish species | 4.3 |
| c Buying water to increase river flows and water levels in lakes for fish | 3.7 |
Scale: 1=Least important, 2= Somewhat important, 3=Important, 4=Very important, 5=Most important
The chart below demonstrates that for all items in this topic over 50% of respondents indicated each item was very or most important.
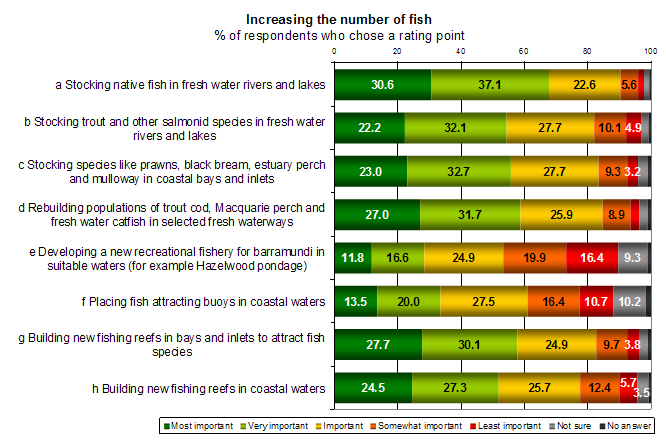
Increasing the number of fish for recreational fishers to catch
The table below shows the mean scores for all items in this topic. There is considerable variation in mean scores with a difference of a full rating point between the highest and lowest rated activities. The scores for these items have been bolded for easier reference. The barramundi activity has one of the lowest overall scores in the survey.
| ITEM | MEAN |
|---|---|
| a Stocking native fish in fresh water rivers and lakes | 3.9 |
| b Stocking trout and other salmonid species in fresh water rivers and lakes | 3.6 |
| c Stocking species like prawns, black bream, estuary perch and mulloway in coastal bays and inlets | 3.7 |
| d Rebuilding populations of trout cod, Macquarie perch and fresh water catfish in selected fresh waterways | 3.7 |
| e Developing a new recreational fishery for barramundi in suitable waters (for example Hazelwood pondage) | 2.9 |
| f Placing fish attracting buoys in coastal waters | 3.1 |
| g Building new fishing reefs in bays and inlets to attract fish species | 3.7 |
| h Building new fishing reefs in coastal waters | 3.6 |
Scale: 1=Least important, 2= Somewhat important, 3=Important, 4=Very important, 5=Most important
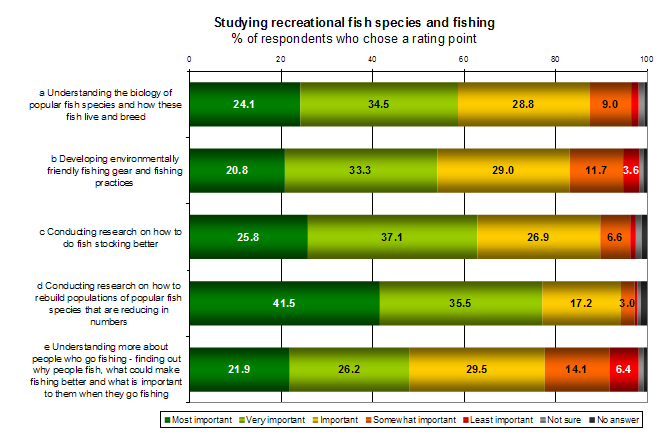
Studying recreational fish species and fishing
The table below displays all mean scores for the topic. The highest and lowest scoring items have been bolded for easier reference. The highest scoring item in this topic is the second highest scoring item in the entire survey.
| ITEM | MEAN |
|---|---|
| a Understanding the biology of popular fish species and how these fish live and breed | 3.7 |
| b Developing environmentally friendly fishing gear and fishing practices | 3.6 |
| c Conducting research on how to do fish stocking better | 3.8 |
| d Conducting research on how to rebuild populations of popular fish species that are reducing in numbers | 4.2 |
| e Understanding more about people who go fishing - finding out why people fish, what could make fishing better and what is important to them when they go fishing | 3.4 |
Scale: 1=Least important, 2= Somewhat important, 3=Important, 4=Very important, 5=Most important
The chart below displays the frequency distribution for this topic.
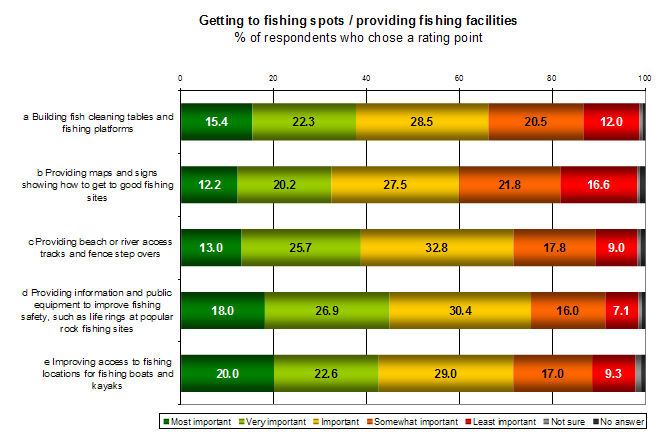
Getting to fishing spots and providing fishing facilities
The table below shows all rated items for this topic. Highest and lowest scoring items have been bolded for easier reference. All items in this topic were amongst the lower rated items in the entire survey. It appears that recreational fishers do not want to make fishing easier for themselves or others; rather they want more fish to catch.
| ITEM | MEAN |
|---|---|
| a Building fish cleaning tables and fishing platforms | 3.1 |
| b Providing maps and signs showing how to get to good fishing sites | 2.9 |
| c Providing beach or river access tracks and fence step overs | 3.2 |
| d Providing information and public equipment to improve fishing safety, such as life rings at popular rock fishing sites | 3.3 |
| e Improving access to fishing locations for fishing boats and kayaks | 3.3 |
Scale: 1=Least important, 2= Somewhat important, 3=Important, 4=Very important, 5=Most important
The chart below displays the frequency distribution for items in this topic.
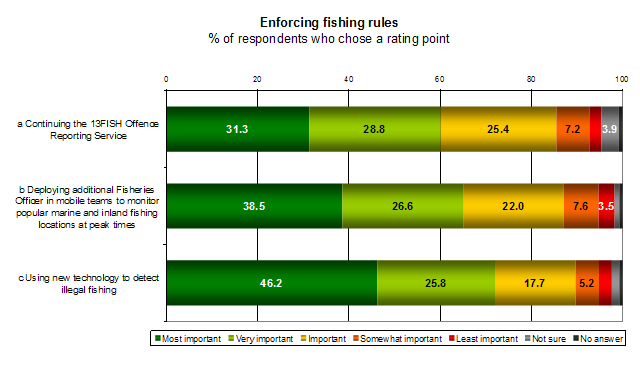
Enforcing fishing rules
There is little variation in the mean scores for this topic. All items rated as very important.
| ITEM | MEAN |
|---|---|
| a Continuing the 13FISH Offence Reporting Service | 3.8 |
| b Deploying additional Fisheries Officer in mobile teams to monitor popular marine and inland fishing locations at peak times | 3.9 |
| c Using new technology to detect illegal fishing | 4.1 |
Scale: 1=Least important, 2= Somewhat important, 3=Important, 4=Very important, 5=Most important
The chart below displays the frequency distribution for activities in this topic.
Introducing plastic recreational fishing licenses
There was only one item in this topic. The table below displays both the frequency distribution and the mean score for this item. This is the lowest rated item in the entire survey.
| IMPORTANCE OF INTRODUCING PLASTIC FISHING LICENCES | FREQ | % |
|---|---|---|
| Least important | 1,431 | 32.4 |
| Somewhat important | 708 | 16.1 |
| Important | 774 | 17.5 |
| Very important | 703 | 15.9 |
| Most important | 729 | 16.5 |
| Not sure | 46 | 1.0 |
| No answer | 20 | 0.5 |
| Total | 4,411 | 100.0 |
| Mean | 2.7 | |
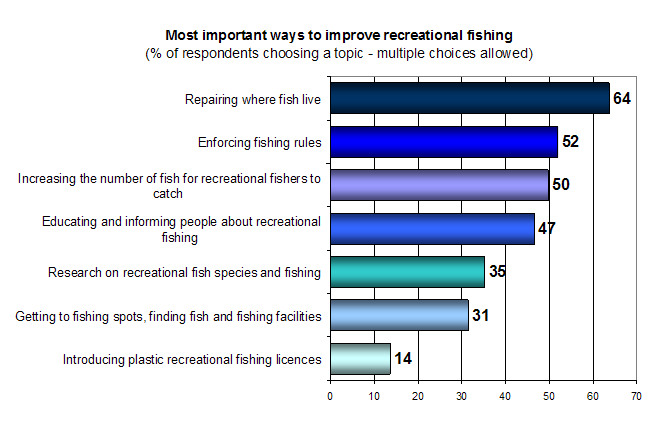
Overall importance
Respondents were asked to select which items were most important at an overall or topic level. The chart below displays the percentage of respondents who selected a particular topic. Repairing where fish livewas the most important topic and also contained the most highly rated item in the entire survey - helping to control pest fish species.
Differences between groups
This section displays items that were statistically significantly different between groups. Comparisons were made between different regions, age groups and methods of fishing.
When interpreting the tables it is important to note that yellow highlighting in bold indicates where an item is statistically significantly higher for a particular sub-group and blue highlighting in italics indicates where an item is significantly lower for a sub-group. Note the comment in the methodology section about why some items may be the same or similar scores yet still considered statistically different.
Regional differences
The table below displays the items that are statistically significantly different between regions. Port Phillip respondents are more interested in access, information and facilities, while the northern region respondents are more interested in fish stocking in fresh water. These regional differences indicate that there is not a single answer to an activity – results vary considerably by fishing location. However, because Port Phillip respondents form the majority of respondents and fishers, their views are dominant.
| ITEM | PORT PHILLIP & WESTERN PORT N=2442 | NORTH WEST N=246 | SOUTH WEST N=393 | NORTH EAST N=646 | GIPPSLAND N=668 |
|---|---|---|---|---|---|
| Teaching primary school children about fish habitat and how to fish | 3.4 | 3.6 | 3.5 | 3.4 | 3.4 |
| Running fishing clinics for children | 3.1 | 3.3 | 3.2 | 3.2 | 3.0 |
| Stocking native fish in fresh water rivers and lakes | 3.8 | 4.3 | 3.9 | 4.2 | 3.9 |
| Stocking trout and other salmonid species in fresh water rivers and lakes | 3.5 | 3.6 | 3.5 | 4.0 | 3.6 |
| Stocking species like prawns, black bream, estuary perch and mulloway in coastal bays and inlets | 3.7 | 3.6 | 3.6 | 3.5 | 3.8 |
| Rebuilding populations of trout cod, Macquarie perch and fresh water catfish in selected fresh waterways | 3.6 | 4.2 | 3.7 | 3.9 | 3.8 |
| Placing fish attracting buoys in coastal waters | 3.3 | 2.8 | 3.0 | 2.8 | 3.0 |
| Building new fishing reefs in bays and inlets to attract fish species | 3.9 | 3.4 | 3.4 | 3.4 | 3.6 |
| Building new fishing reefs in coastal waters | 3.7 | 3.3 | 3.4 | 3.2 | 3.4 |
| Conducting research on how to do fish stocking better | 3.7 | 4.0 | 3.8 | 4.0 | 3.8 |
| Building fish cleaning tables and fishing platforms | 3.3 | 2.7 | 3.0 | 2.6 | 3.0 |
| Providing information and public equipment to improve fishing safety, such as life rings at popular rock fishing sites | 3.4 | 3.2 | 3.2 | 3.2 | 3.2 |
| Improving access to fishing locations for fishing boats and kayaks | 3.4 | 3.0 | 3.1 | 3.2 | 3.1 |
Scale: 1=Least important, 2= Somewhat important, 3=Important, 4=Very important, 5=Most important
Respondent age differences
The table below displays the items that are significantly different between age groups. Where there are statistical differences, older respondents tend to have higher scores (more things are more important), while younger respondents tend to have lower scores (more things are less important). However, both youngest and oldest groups are more interested in a barramundi fishery and younger people are interested in fish attracting buoys. Younger people are also less interested in compliance activities.
| ITEM | 18-34 N=976 | 35-44 N=1,237 | 45-54 N=1,291 | 55+ N=907 |
|---|---|---|---|---|
| Providing up-to-date information about good fishing practices and fishing rules like fish length stickers, signage and a fishing guide book | 4.0 | 3.9 | 4.0 | 4.1 |
| Running fishing clinics for children | 3.0 | 3.2 | 3.1 | 3.1 |
| Involving multi-cultural communities in recreational fishing | 2.9 | 2.9 | 3.1 | 3.2 |
| Promoting recreational fishing as a healthy activity | 3.3 | 3.3 | 3.4 | 3.6 |
| Helping charter fishing boat operators and fishing guides to use good fishing practices | 3.6 | 3.7 | 3.7 | 3.8 |
| Stocking native fish in fresh water rivers and lakes | 3.9 | 3.9 | 3.9 | 4.0 |
| Stocking trout and other salmonid species in fresh water rivers and lakes | 3.5 | 3.5 | 3.6 | 3.8 |
| Stocking species like prawns, black bream, estuary perch and mulloway in coastal bays and inlets | 3.6 | 3.6 | 3.7 | 3.8 |
| Rebuilding populations of trout cod, Macquarie perch and fresh water catfish in selected fresh waterways | 3.7 | 3.6 | 3.8 | 3.9 |
| Developing a new recreational fishery for barramundi in suitable waters (for example Hazelwood pondage) | 3.1 | 2.7 | 2.8 | 3.0 |
| Placing fish attracting buoys in coastal waters | 3.2 | 3.0 | 3.1 | 3.1 |
| Understanding more about people who go fishing - finding out why people fish, what could make fishing better and what is important to them when they go fishing | 3.3 | 3.4 | 3.5 | 3.6 |
| Building fish cleaning tables and fishing platforms | 2.9 | 3.1 | 3.2 | 3.2 |
| Providing maps and signs showing how to get to good fishing sites | 2.9 | 2.8 | 2.9 | 3.0 |
| Continuing the 13FISH Offence Reporting Service | 3.6 | 3.9 | 3.9 | 3.9 |
| Deploying additional Fisheries Officer in mobile teams to monitor popular marine and inland fishing locations at peak times | 3.8 | 3.9 | 4.0 | 3.9 |
| Using new technology to detect illegal fishing | 3.9 | 4.1 | 4.2 | 4.2 |
Scale: 1=Least important, 2= Somewhat important, 3=Important, 4=Very important, 5=Most important
Method of fishing differences
The table below displays the significantly different items between different methods of fishing. Not surprisingly land-based fishers are less interested in coastal activities, while boat-based fishers are more interested in coastal activities. Again, this reinforces that there is not a single answer to preferred activities – it depends on the nature of the respondent.
Note that the three sub-groups in this analysis are fairly equally represented, so that one group is not dominating results.
| ITEM | LAND-BASED N=1637 | BOAT-BASED N=1543 | MIXTURE OF LAND & BOAT N=1216 |
|---|---|---|---|
| Providing up-to-date information about good fishing practices and fishing rules like fish length stickers, signage and a fishing guide book | 3.9 | 4.0 | 4.1 |
| Helping charter fishing boat operators and fishing guides to use good fishing practices | 3.6 | 3.8 | 3.7 |
| Helping to control pest fish species | 4.2 | 4.4 | 4.4 |
| Buying water to increase river flows and water levels in lakes for fish | 3.7 | 3.6 | 3.8 |
| Stocking native fish in fresh water rivers and lakes | 3.9 | 3.8 | 4.0 |
| Stocking trout and other salmonid species in fresh water rivers and lakes | 3.7 | 3.4 | 3.7 |
| Stocking species like prawns, black bream, estuary perch and mulloway in coastal bays and inlets | 3.6 | 3.7 | 3.7 |
| Rebuilding populations of trout cod, Macquarie perch and fresh water catfish in selected fresh waterways | 3.8 | 3.6 | 3.8 |
| Placing fish attracting buoys in coastal waters | 2.9 | 3.3 | 3.1 |
| Building new fishing reefs in bays and inlets to attract fish species | 3.5 | 3.9 | 3.7 |
| Building new fishing reefs in coastal waters | 3.4 | 3.7 | 3.5 |
| Understanding more about people who go fishing - finding out why people fish, what could make fishing better and what is important to them when they go fishing | 3.4 | 3.5 | 3.4 |
| Building fish cleaning tables and fishing platforms | 2.8 | 3.4 | 3.1 |
| Providing maps and signs showing how to get to good fishing sites | 3.0 | 2.9 | 2.8 |
| Providing beach or river access tracks and fence step overs | 3.3 | 3.0 | 3.2 |
| Improving access to fishing locations for fishing boats and kayaks | 2.7 | 3.7 | 3.4 |
| Continuing the 13FISH Offence Reporting Service | 3.7 | 3.9 | 3.8 |
| Deploying additional Fisheries Officer in mobile teams to monitor popular marine and inland fishing locations at peak times | 3.8 | 4.0 | 3.9 |
| Using new technology to detect illegal fishing | 4.0 | 4.2 | 4.1 |
Scale: 1=Least important, 2= Somewhat important, 3=Important, 4=Very important, 5=Most important
Other activities that could improve recreational fishing in Victoria
Respondents were given the opportunity to answer two free text questions about improving fishing. Respondents were asked to indicate other activities that could improve recreational fishing in Victoria and then asked to explain why such activities were important to them.
This section describes the major themes of the free text and provides exemplary comments for each theme.
The comments question was answered by 1,545 respondents - 35% of respondents. There were only two commonly occurring themes, each mentioned by about a third of those who responded. After these two common themes, other themes were much less common.
Improve boat facilities including ramps
The theme covers boat facilities including, launching, ramps and better access to facilities. Ramps were the most commonly mentioned concept within this theme.
Expand the number, capacity, quality & safety of boat ramps in all major bays, estuaries, lakes and offshore access areas. Include safe and practical temporary mooring facilities to assist safe launching & retrieval of boats & occupants with all boat ramps to have excellent fish cleaning facilities - benches, running water & lighting, similar to facilities found in other States - such as NSW.
Improved boat ramp facilities, for example, paved roads to the ramps can car park. Do not allow local council to charge for parking at boat ramps (any revenue raised should go to fisheries). Open more launch facilities in Western Port and Port Phillip.
Why this is important
To relieve congestion.
Waiting an hour or more to launch or retrieve your boat is ridiculous.
It's not nice when your car is half under water when trying to retrieve your boat.
Fish limits
Fish limits was the next most commonly mentioned theme. This included bag, size and seasonal limits.
Educating new Australians on the importance of bag limits. Increasing size limits on rec fish so as the fish have a chance to breed and thus making the size of the fish a reasonable size to take for example the south Australian model for snapper and whiting seems to be very sustainable and give fishers a reasonable fish to take . The minimum size 40cm for a Vic snapper is unrealistic.
Education about only taking what you need - not all you catch! Putting limits on the number of fish you can take home and also on the number of the larger fish that you are able to take home to help the fish breed naturally. Protect their habits.
During peak fishing periods, such as the height of the snapper season, there are many examples of catches exceeding bag limits. Regular patrolling of ramps such as Mordialloc and searching boats would improve Victorian recreational fishing.
Why this is important
The only way to have a lasting fishery is to make sure the fish themselves are looked after. All other actions are merely secondary. Fish must have somewhere to breed and must be allowed to reach a good mature age, not just one supposed chance but several chances. Some years fish do not breed due to reasons like drought or flood etc. Therefore if a fish only has one chance it may be the year conditions were not right.
They [the rules] are confusing to a number of people especially migrants.
Increasing populations and over exploitation of a limited resource will result in very poor fishing in the future. Standing shoulder to shoulder at fish out ponds or queuing to catch just released hatchery fish in rivers is not a substitute for fishing for self sustainable populations of 'wild' fish.