Methodology
2.1 Introduction
The use of environmental resource and amenities provides an economic value in terms of the ecosystem service provided to those individuals accessing them4. The value of the benefits and enjoyment derived from the SBT fishery can be inferred from current revealed market transactions or stated non-market values, which are the basis of environmental valuation techniques. These techniques are generally used to value the environment and to construct measures of welfare arising from changes in the environment.
This section provides an overview of existing valuation techniques and outlines the rationale for Deloitte Access Economics' adopted valuation methodology. Application of the relevant methods and the survey design used for anglers and charter operators are then discussed.
2.2 Choice of valuation technique
2.2.1 Possible valuation techniques
The following discussion reflects our understanding of relevant academic literature, as well as manuals and reports used in the public sector in the field of natural resource valuation. In particular, there are several defining characteristics of what we are valuing here – the enjoyment derived from recreational SBT fishing – that leads to the choice of valuation approach. These are:
- The site and species specific nature of the valuation – this is an assessment of the value of marine recreational fishing in South West Victoria, departing from Portland, and for SBT species, not a general valuation of recreational fish overall.
- It is a valuation of the fishing experience for wild SBT fish. The resource is renewable, i.e. there is a concept of sustainable yield.
- This is an open-access resource, implying that in the presence of catch and release, the direct use value of SBT fishing experience is non-excludable (i.e. can be accessed equally5) among fishermen, while under catch and keep the fishing experience may be limited by competing fishing activities (particularly as congestion develops).
Although there is no market for the environmental goods in recreational fishing, any changes in the ecosystem are likely to affect economic behaviour6. The value of recreational fishing can be partly measured by economic transactions directly associated with the recreational fishing industry (e.g. income from recreational fishing to boat shops, manufacturers of fishing products, government through licensing fees or tourist operators) and indirectly through economic activities that are not directly associated with recreational fishing, but partially attributable to it (e.g. accommodation, fuel purchased, etc.). The value to the local economy of recreational fishing can be further estimated by feeding in expenditure data associated with the recreational experience into Input-Output tables, which map out the structure of industries in a given economy.
Recreational fishing also has an important non-market value, in relation to the challenge of and the satisfaction associated with catching fish. Some of this value may be linked to the market values but may be much greater than what the angler has to pay in order to fish. In other words, there may be a surplus value, above and beyond what the fisher has had to pay to access the fishery.
A range of techniques can be employed to estimate the value placed on recreational fishing. Broadly, they can be categorised into (1) revealed preference valuation methods and (2) elicited preference valuation methods.
Revealed preference valuation methods
Revealed preference methods are most appropriate for establishing the economic contribution of environmental amenities. These methods use data from actual market transactions to derive consumer surplus estimates. They include the travel cost method (TCM), hedonic pricing and random utility modelling (RUM). The choice of method depends on the asset or activity under consideration. The travel cost method is the traditional survey-based technique applied in the context of recreational sites7, where the value is primarily use-related.8
In the case of the recreational fishing experience for SBT the value is very clearly a use value – the angler must pay some expense to travel and experience the fishing. However, travel cost alone may understate the true value of the recreational fishing experience, especially for day visitors who reside in the visiting region. Understanding the contribution of specific attributes anglers derive enjoyment from, such as the enjoyment from boating or enjoying the outdoors, are also not captured in the traditional TCM.
Elicited preference valuation methods
Contingent valuation techniques have been implemented more recently as a well-known stated preference technique to elicit information that cannot be assessed from existing market transactions. The Contingent Valuation Method (CVM) is easiest to implement, as compared with the RUM-based Discrete Choice Modelling (DCM). In the case of recreational fishing, this technique involves asking respondents directly to place an economic value on the use of natural assets such as fisheries, or a specific attribute in the activity that directly influences the respondent's level of enjoyment. The idea is to establish the trade-off between asset enjoyment/use and a monetary value conditional on a specified hypothetical scenario.
2.2.2 Adopted approach
For this study, Deloitte Access Economics adopted both approaches. To overcome the limitations of the TCM, a standard TCM was supplemented with a number of additional questions allowing for contingent choices, via the CVM.
The TCM is directly applicable to the decision problem in relation to the full expenditure towards recreational fishing for SBT, as a single-site open-access resource, with Portland as the port of reference. From this data, it is possible to derive the demand for recreational fishing for SBT at Portland and derive the current value9 that this activity directly generates in the local and regional economy.
The CVM allows testing of whether anglers perceive an additional value on the use of the natural asset by asking the fishermen directly if they would be willing to pay an additional x% for their fishing experience or whether they would be willing to travel further to access the SBT fishery.
Furthermore, the TCM provides only a point estimate of current expenditure by fishermen, whereas the additional information conveyed through the CVM can provide a distribution of the direct value of what fishermen are currently willing to spend to access the 2012 SBT fishing season. This is a more complete and informative measure of SBT fishing value.
Potential bias in contingent valuation can be related to the hypothetical nature of questions or the fact that the questions may provide no incentive for anglers to reveal truthful preferences. These biases can be minimised by a robust survey design that includes appropriate questions around the TCM information.
The individual estimates provided by the TCM and CVM were also supplemented by additional data sources, such as a survey of charter boat operators, previous DEPI reports, trailer count and licences sales, to best extrapolate the survey results to the population of anglers that have joined the SBT season in Portland. Figure 2.1 below outlines our approach.
Figure 2.1: Our approach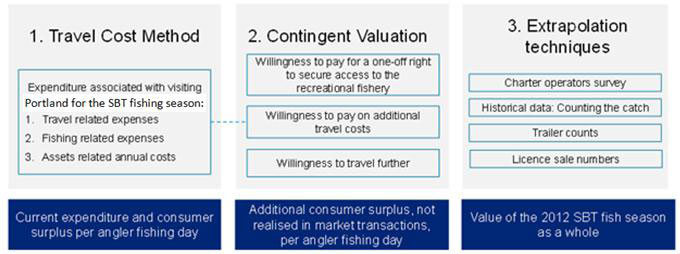
2.3 Survey design
The survey was designed to elicit the value that anglers place on the SBT fishing season in Portland. Two surveys were deployed – one for recreational anglers and another for charter boat operators. To assist in survey design, a pilot survey was run with a group of 10 anglers prior to the main survey.
2.3.1 Survey of recreational anglers
The questionnaire to anglers was developed and tested through 10 pilot phone interviews, with the aim of maximising the number of responses within the travel cost approach, narrowing down to key questions to derive expenditure estimates. The questionnaire to recreational anglers is provided in Appendix A.
The survey, which was delivered through face-to-face interviews10, comprised a combination of both open and closed questions around:
- angler characteristics and information on recreational fishing activity;
- expenditure associated with the trip to Portland and recreational SBT fishing; and
- contingent valuation to elicit additional willingness to pay for SBT fishing.
Recreational fishing activity questions
Questions on recreational activity were included to understand anglers' choice to travel to Portland in relation to SBT, and elicit details about their trip, preferences for catch-to-keep or catch-and-release practices, as well as their expected frequency of fishing days in the current trip and in 2012. Most of this information is important to convert the expenditure data consistently into per-fishing-day and per-angler expenditure.
Expenditure questions
Expenditure questions for recreational fishing were developed based on existing literature such as Bennett (1995) and Rolfe and Prayaga (2007). The travel costs in this survey are mainly derived by considering all perceived costs for the entire fishing trip to Portland provided by the respondents (alternatively, expenditure on petrol or using the distance travelled with a specific driving cost per km was used as a benchmark). These costs were structured into a list of fishing-related and trip-related cost items aligned with the classification for goods and services in Input-Output tables, as discussed with DEPI.
Fixed annual costs from major assets, such as boats, were considered separately. The main expenditure groups captured in the survey are listed in Table 2.1. To address the problem with shared expenses that arise in multipurpose trips (e.g. the purpose of the trip may be mainly holiday or visiting relatives/friends), the survey asked anglers to apportion the costs related to SBT fishing.
| Costs | Main items |
|---|---|
| Fixed annual | Boat and others (e.g. trailer, licences, maintenance) |
| Fishing costs | Charter fees (where applicable), fuel for boat, tackle, bait |
| Trip costs | Fuel for motor vehicle, accommodation, food and drink from restaurants/hotels versus shop/supermarkets |
It is also possible to include time spent travelling as part of the travel costs, if there is an opportunity cost on the travel time. However, recreational activities are usually undertaken during holiday periods or non-working time, which implies that there would not be any loss of income. In this context, travel time can be considered as part of the recreational experience and was not valued additionally.
Contingent valuation questions
In the literature there are guidelines for the application of CVM techniques to estimate a trade-off between people´s willingness to pay for an improvement in environmental and recreational amenities – see for example, Cameron (1992), Herath and Kennedy (2004), Carson and Louviere (2010), Carson and Hanemann (2005) and Carson and Groves (2007). In designing this part of the survey it was important to formulate clear and realistic questions using an appropriate payment vehicle, in order to avoid potential bias (the pilot survey phase was particularly useful for providing feedback to modify some contingent valuation questions).
The contingent valuation section in the survey started with a brief description of the status of the SBT recreational fishery, in which the interviewer provided a common frame for the subsequent questions to elicit anglers' willingness to pay (using diverse forms of payment, so-called 'payment vehicles', to obtain a robust estimate of the anglers' willingness to pay for securing their recreational activity):
- The first question was an open-ended question. While not a preferred type of question to elicit a monetary value, its purpose was mainly to establish whether anglers would be willing to pay for a one-off access right (beyond their current expenditure) to secure part of the total SBT catch for recreational fishing.
- The second question was made in a single binary choice format (i.e. yes/no response), the simplest format possible, asking anglers whether they would continue to fish for SBT in Portland if their travel costs increased by a given percentage on top of their current expenditure (previously detailed by the respondent).
- In the third question, anglers were asked how much further they would be willing to travel if there were no SBT were coming to Portland.
2.3.2 Survey to charter boat operators
Charter boat operators were provided with a separate survey to obtain a more complete picture of the recreational SBT fishery and to collect information that can be used as an input into DEPI's economic contribution analysis. As charter operators may be unlikely to disclose expenditure information over the phone, an amended survey was developed that could be delivered in person at the main boat ramp in Portland.
At a high level, the survey included the following sections:
- number of days and frequency of operation during the 2012 SBT season in Portland;
- number of customers per fishing trip;
- charter boat fees; and
- expenditure of charter boat operations in Portland.
The questionnaire to the charter boat operators is provided in Appendix C.
2.4 Sample selection and response rate
2.4.1 Selection of survey days
In order to maximise representativeness of the sample, sampling days should generally be randomised as much as possible. This means that ideally the survey period should have covered the full length of the 2012 SBT season to account for variations over the course of the season. However, timing of the project meant that this was not possible.
Similarly, the selection of survey days should be as random as possible throughout the sampling period. However, practical and budget reasons meant that a selection of independent random days was not feasible.
To ensure that the sample was as random as possible, within the constraints of project timing and budget, Deloitte Access Economics decided to undertake the survey on 20 randomly selected survey days over four survey blocks of five days each. The sample was selected to have the following attributes:
- a maximum spread of survey days throughout the middle of the SBT season within the time constraints of this project (this left a five week period throughout May and June);
- a representative number of both weekdays and weekend days (each block of five days covered both weekdays and weekends);
- a variation in the weekdays covered; and
- one public holiday weekend (in the sample this affected 25% of the weekends compared with 15%, or 20% if ANZAC day is included, in the whole SBT season).
Intra-seasonal variation in weather is an exogenous factor that would typically be difficult to incorporate into the sample design process. However, given the potentially large impact of weather on anglers' decision-making for fishing activities, we undertook some tests after the survey was completed to establish whether the variability in the weather on survey days had been in line with the overall seasonal patterns of the year.
2.4.2 Measures in place to ensure representative sample
To ensure that the sample is representative and to avoid any systematic bias in the survey results, the following measures were taken:
- only one angler was interviewed per boat or group of anglers going fishing together;
- any given angler was interviewed only once in the SBT season;
- random selection of anglers throughout the survey day;
- random selection of angler types (i.e. there was no predetermined ratio of anglers on charter boats and anglers on private boats);
- variability in interview times over the course of each survey day;
- limiting the survey to essential questions in order to minimise interview time and maximise number of responses;
- interviews with charter boat operators (to test responses provided by anglers on charter boats); and
- count of trailers (to assess whether some anglers have been missed – particularly on good weather days).
2.4.3 Response rate
Recreational anglers
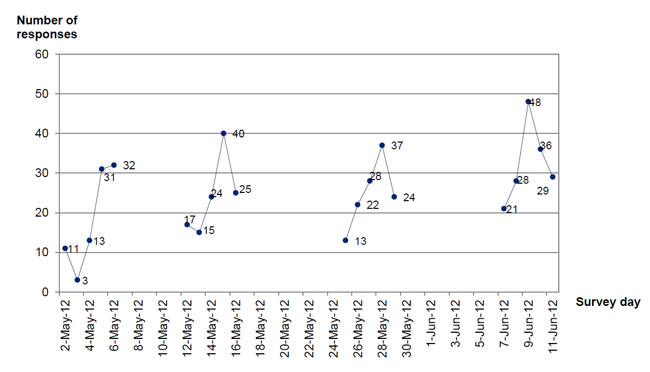
Over those 20 survey days, AFS Smart Askers conducted interviews with 497 recreational anglers (an average of 24.85 anglers per day) – as shown in Table 2.2 and Chart 2.1. The notable variation in response rates over the survey days partly reflects the preference for fishing between weekends and weekdays (weekends being preferred for most visitors), but is also explained by changes in weather. There were only eight refusals to the survey.
| Block 1 2-6 May 2012 | Block 2 12-16 May 2012 | Block 3 25-29 May 2012 | Block 4 7-11 June 2012 | |
|---|---|---|---|---|
| Monday | - | 24 | 37 | 291 |
| Tuesday | - | 402 | 242 | - |
| Wednesday | 11 | 252 | - | - |
| Thursday | 3 | - | - | 212 |
| Friday | 13 | - | 13 | 282 |
| Saturday | 312 | 17 | 22 | 482 |
| Sunday | 322 | 15 | 28 | 362 |
| TOTAL | 90 | 121 | 124 | 162 |
| 1 Queen's Birthday public holiday. 2 busy days (trailer counts indicate more boat trips than people surveyed). | ||||
Chart 2.1: Responses over time
Charter boat operators
AFS Smart Askers talked to 20 representatives from 18 charter boat operators11. This represents all charter boat operators that are active in Portland during the 2012 SBT season (according to the list of charter operator businesses provided by DEPI).
The charter operators were, in most cases, intercepted at the main boat ramp on their return from the fishing day. As some charter operators may depart from other points in Portland, Deloitte Access Economics contacted the remaining charter operators that had not been interviewed prior to our survey blocks to establish the days they planned to be operating and their point of departure. Most charter boat operators were willing to participate in the survey.
Footnotes
4 Existence, passive use or option values are not considered in this project.
5 In reality, lethal effects of catch and release and congestion may limit the equal access somewhat.
6 This is the weak complementary condition required for environmental valuation.
7 It originates from Hotelling's analysis on the value of parks being reflected in travel costs (Prewitt, 1949).
8 Hedonic pricing is a more suitable method for non-use values, such as the enjoyment of pleasant views. It is often critiqued on the basis of its very strong assumptions that the market value of land, for example, reflects associated benefits of an environmental good or service, although there may be a number of determinants driving differences in prices. Random utility modelling would be typically used to value fishing choices in one versus multiple sites, but is relatively data intensive.
9 This measure only reflects the lower bound of the full value for recreational fishing for SBT.
10 Self-responses were not permissible. This approach was chosen because face-to-face interviews tend to provide higher response rates, the interviewer can engage with respondents to elicit information more effectively, leading to higher quality in expenditure responses, as compared with mail or phone surveys.
11 The respondents were assumed to answer on behalf of their boat operations, as independent contractors.