Bathymetric Survey of the Proposed Aquaculture Zone, Pinnace Channel Port Phillip
J.M.Barry and M Bailey
Research Report Series No.35
March 2001
ISSN: 1328-5548
ISBN:
Preferred way to cite this publication:
Barry J M Bailey M (2001). Bathymetric Survey of the Proposed Aquaculture Zone, Pinnace Channel, Port Phillip. Marine and Freshwater Resources Institute Report No. 35. (Marine and Freshwater Resources Institute: Queenscliff).
Introduction
A baseline survey of the physical and biological characteristics of the proposed Pinnace Channel Aquaculture Site in Port Phillip Bay was carried out between June and September 1999 (Coleman et al. 2001). In addition, a bathymetric survey of the area was carried out jointly by the Marine and Freshwater Resources Institute and Redborough Mapping Services (RMS Pty Ltd). The results of the bathymetric survey are reported here.
Methods
The survey was undertaken using a combined Sounder and Differential Global Positioning System (DGPS) unit under the control of Mr Michael Bailey, a licensed Hydrographic Surveyor (see attached Survey Report).
The raw satellite derived positioning data was corrected using the Australian Maritime Safety Authority (AMSA) Differential correction signal transmitted from Cape Schank.
To ensure that sounder derived depths were consistent with actual depth, a Secchi disk was used in depth calibrations. The sounder signal reflected from the disk was compared with measured marks on the Secchi Disk line. This enabled the calibration adjustment of the sounder to allow for water temperature and salinity. Tidal heights were obtained throughout the survey by regular reference to the tidal gauge at the West Channel Pile Light.
The Victorian Channels Authority (VCA) maintains the tidal gauge, which transmits a real time tide height to the signal station at the Point Lonsdale Lighthouse. The gauge is set to record water level above Chart Datum in this part of Port Phillip, which includes the survey area.
All positions were recorded as WGS 84 Latitude and Longitude positions and converted to the Australian Geodetic Datum 1966(AGD66) reference plane for plotting.
The survey lines were run at a separation of 20 meters running in a north west to south east direction and the reverse on the return run.
The Data file of raw depth soundings is archived at MAFRI and with Redborough Mapping Service.
Equipment
Survey Vessel
The Commercial fishing vessel, "A.B.Hunter II" was used to conduct the survey. The vessel is equipped with stabilisers to limit pitch and roll, and deployed as necessary. The vessel, a 13-meter displacement hull type, provided a stable platform for the taking of soundings. The sea conditions for the survey were calm with no discernible swell or wind waves to induce errors in the sounding. These calm conditions prevailed through out the survey.
Sounder Set Up
The sounder was attached out-board over the starboard side of the vessel with the DGPS aerial directly above the sounder to ensure that there were no offset error for position correction.
The sounder used to conduct the survey was a "Ceeducer" single frequency unit, operating at 200 Khz, which measures soundings at a rate of 6 "pings" per second, which at six knots provided a sounding about every half metre.
The "Ceeducer" sounder, DGPS, and data logger comes as a single integrated unit which is a small, lightweight, and has a low power consumption. This made installation on the vessel a simple exercise, requiring only the mounting of an outboard transducer and the combined GPS and differential receiver antenna. The helmsman was able to guide the vessel along the predetermined survey tracks by reference to a display on a handheld "Psion" computer. This computer provided the position of the vessel in relation to the selected survey line, the "distance off line", and the distance and bearing to the start and end of each survey line, as either a pictorial display or in digital format.
Data Post Processing
At the end of the survey all the recorded data was checked for validity using a Hydrographic Survey program, which enabled the Surveyor to view a graphical representation of the recorded depth and position data. Any editing that was required to either parameter was carried out at this stage so that all data subsequently used was valid. The depths were also adjusted to allow for the tide height at the time of the survey and provide depths reduced to a common chart datum.
To reduce the amount of data that had to be processed to provide contours and other representations of depth, the data was thinned to one sounding every 4 to 5 metres. This data thinning still provided a valid representation of the seabed, but reduced the data processing time to a reasonable level.
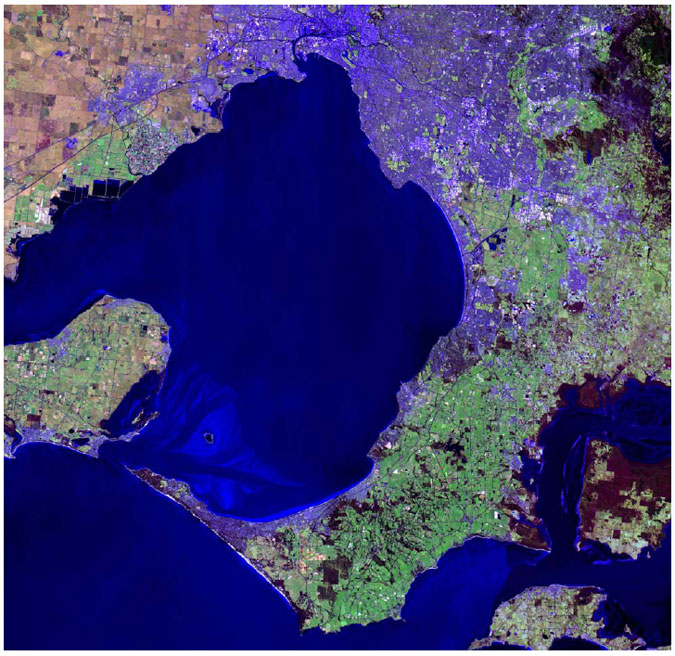
Figure 1 Landsat image of Port Phillip with the approximate position of the Proposed aquaculture zone indicated by the red star.
Survey Site
The site is situated at the southern end of Port Phillip at the northern entrance of the Pinnace Channel (see figure 1). The area surveyed extended beyond the proposed boundaries of the Aquaculture site, this occurred to ensure coverage of the site. The orientation of the boundaries is adjacent to the northeastern face of the Great Sands, an area of sand accretion inside the entrance of Port Phillip.
Figure 2 shows the orientation of the boundaries and the direction of the survey lines marked with arrows are indicative of the direction of survey sounding runs. This long axis direction for the survey lines was chosen to limit the number of turns the survey vessel had to negotiate, and thus shorten the survey time.
Note: The contour lines represented in figure 2 are derived from a shape file, based on bathyometry data collected prior to 1968, to a scale and definition that is less detailed than described in this report.
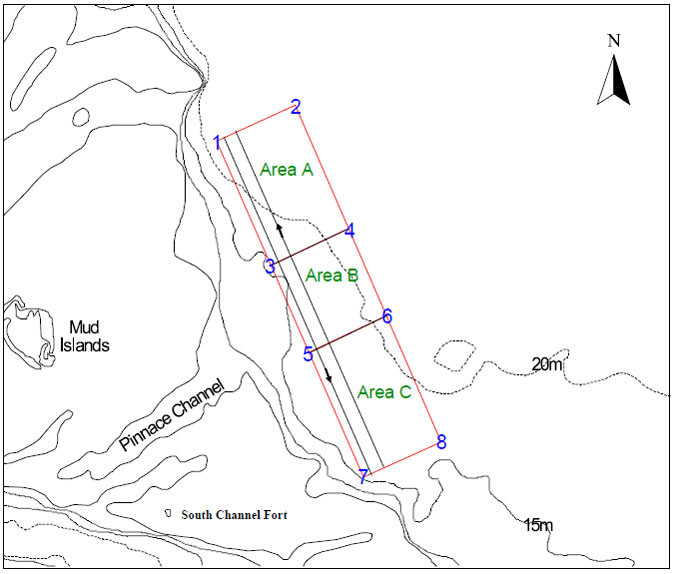
Figure 2 Boundries of the proposed Pinnace Channel Aquaculture Site
The site is divided into three areas. A and C are to be used for aquaculture, and B is to be used as a control zone. Arrows indicate the direction of survey lines and the numbers 1 to 8 indicate the corner boundary positions
Site Boundaries
The position of the boundary was supplied from Mr David Ball of the GIS section of MAFRI from data provided by the Natural Resources Systems section of the Department of Natural Resources Melbourne.
To aid in the identification of the site boundaries the co-ordinates have been presented in two forms, Geographical and Australian Map Grid.
| Position Number | Latitude | Longitude |
|---|---|---|
| 1 | 38,13.976,S | 144,49.929,E |
| 2 | 38,14.353,S | 144,48.792,E |
| 3 | 38,15.748,S | 144,49.535,E |
| 4 | 38,15.372,S | 144,50.672,E |
| 5 | 38,16.724,S | 144,50.054,E |
| 6 | 38,16.347,S | 144,51.192,E |
| 7 | 38,18.119,S | 144,50.799,E |
| 8 | 38,17.742,S | 144,51.936,E |
Table 1. Aquaculture zone boundary corners. Geographical Coordinates, AGD66
| Position Number | Easting | Northing |
|---|---|---|
| 1 | 308618 | 5765367 |
| 2 | 310260 | 5766103 |
| 3 | 309763 | 5762812 |
| 4 | 311405 | 5763547 |
| 5 | 310562 | 5761025 |
| 6 | 312205 | 5761761 |
| 7 | 311708 | 5758470 |
| 8 | 313350 | 5759206 |
Table 2. Aquaculture zone boundary corners. Australian Map Grid Coordinates AGD66
Site Description
The proposed aquaculture site lies at the northern edge of a sand accretion area known as the "Great Sands". This sand accretion occurs as a result of sand transported through the Heads on the flood tide. The site can be characterised as a gently sloping bedform from 15 meters in the southwest to the 24 meters northeast.
A contour map drawn from the Survey Data file of the proposed Aquaculture Zone is presented as figure 4. The map has been drawn from the original Survey Data set, and thus shows the total area surveyed rather than just the area inside the defined boundaries of the proposed aquaculture site.
The proposed Aquaculture site comprises 3 sections,
- Area A slopes from the south west to the north east. The steepest gradient being in the southwestern corner
- Area B is of fairly uniform gradient from 15 meters in the West to 23 in the north east.
- Area C is the flattest of the 3 areas apart from a "figure of 8 " depression in the southeast corner (see site discussion). The slope is of fairly uniform gradient from 16 meters in the West to 20 in the North.
Physical Size of the Proposed Aquaculture Zone
The site is defined by boundary corner points (see table 1 &2). These boundaries define three rectangles with the following characteristics:
Area A
The northern of the aquaculture zone comprises an area of 5.095sq kilometres, approx 500Ha.
| Length: | 2805 meters |
| Width: | 1804 meters |
Area B
The central control zone comprises an area of 3.541sq kilometres, approx 350Ha.
| Length: | 1966 meters |
| Width: | 1804 meters |
Area C
The southern aquaculture zone comprises an area of 5.095sq kilometres, approx 500Ha.
| Length: | 2805 meters |
| Width: | 1804 meters |
Site Discussion
Of note in Area C is the "figure of 8" shaped depression in the southeast corner. This feature is characterised by two adjoining holes, below the normal seabed of 17meters, to a depth of 30meters. This feature is not too dissimilar the "Portsea Hole" a depression near Portsea pier and other similar features close to Port Phillip Heads. Reference to a report Holdgate et al., (1981) describes the existence of late Pleistocene river channels which are now buried beneath bay floor sand and mud.
The "figure of 8" depression is in a direct line with the channels identified in this report and is thus likely to be connected with these ancient river channels. Interpretation of these channels is complicated by the in-fill of mud and sand to a cover hight of 40meters in some places (Holdgate et al., ). Further study by a modern sub-bottom profiler would be necessary to fully describe the extent of this feature and it's connection to the Pleistocene channels of Port Phillip.
Coloured Contour and Surface Plot
To aid in the understanding and interpretation of the bathyometry, a three-dimensional coloured contour and grided surface plot is provided (see Figure 6). This plot has had the Easting scale distorted to provide a better visualisation of the bottom topography.
Results
The results of the survey are provided as figures, tables and attachments in this report:
- Quality Assured Survey Report, figure 3.
- A chart of the aquaculture area with boundary overlay, figure 4.
- Three-dimensional contour plot with boundary points, figure 5.
- Surface and 3D grided bottom contour plot of survey area, figure 6.
- Bathymetric charts attachments in Tiff image files 1, 2,3 & 4.
The Tiff images on the CD-Rom have been reproduced from charts provided by RMS Pty Ltd. Cropping the original data set produced the Charts. This cropping excluded all soundings outside the defined area of the proposed aquaculture zone. The Tiff images may be viewed by most desktop publishing applications or inserted into Microsoft applications.
Note: The originals of the raw sounding data and the A1 charts produced by Redborough mapping Services are held at MAFRI Queenscliff for archival purposes.
References
LATE PLEISTOCENE CHANNELS IN PORT PHILLIP HOLDGATE G.R, THOMPSON B.R, GUERN B
(Royal Society of Victoria Proceedings 1981 pages 119-130)
Figure 3
Redborough Mapping Service
ACN 054 905 257 ABN 93 054 905 207
Office: 68 Foch St Box Hill South, Victoria, 3128
Phone (03) 9890 0891, Fax( 03) 9899 4077, Mobile 0417 847 406,
Email mbailey@melbpc.org.au
SURVEY REPORT
Proposed Aquaculture Site
Pinnace Channel, Port Phillip Bay.
The survey was carried out from the 25th to the 28th June 1999
Horizontal datum is Australian Map Grid Zone 55.
Position coordinates were derived by differential GPS using the differential position corrections broadcast by the Australian Maritime Safety Authority from Cape Schank.
Horizontal accuracy of sounding position is +/- 1.5 metres
Vertical datum is Chart Datum for Port Phillip, derived from tidal data supplied by the Victorian Channels Authority.
This datum is 0.524 metres below Australian Height Datum.
Vertical accuracy of sounding is +/- 0.1 metres.
The soundings were taken using a 200 Khz depth sounder. At this frequency, there is negligible penetration into the seabed and the top of the seabed is measured.
Depths were recorded approximately every 0.5 metres along the vessel track, with the tracks approximately 20 metres apart.
All position and depth recording and data quality control checks were carried out personally.
Raw and processed data files were transferred to Marine and Freshwater Resources Institute for subsequent processing.
Michael E Bailey LS MIS. (Aust) Hydrographic Surveyor
Figure 4
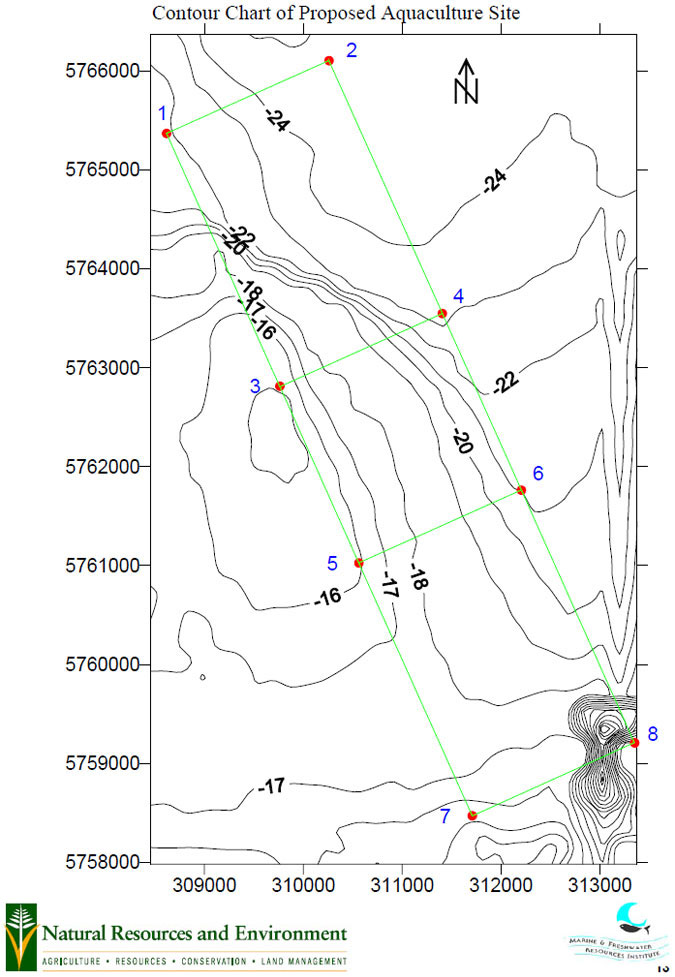
Figure 4 Contour Chart of Proposed Aquaculture Site
Figure 5
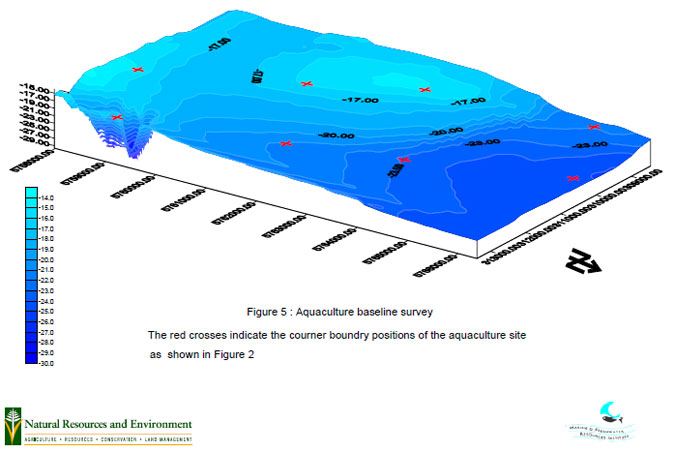
Figure 5 Contour Chart of Proposed Aquaculture Site, with boundaries.
Figure 6
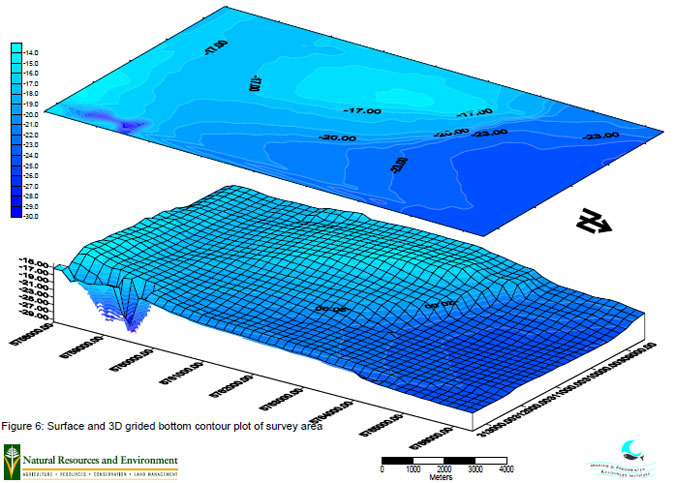
Figure 6 Coloured Contour and 3D Surface Plot