Assessment of Venus Bay Pipis
 Jacinta Early, Zac Lewis, Dr Mark Scarr and Dr Carol Scarpaci
January 2013
Final Recreational Fishing Grants Program Research Report
Contents
- Executive summary
- Introduction
- Methods
- Study site
- Biological sampling
- Environmental sampling
- Statistical analysis
- Results
- Pipi demographics
- Environmental parameters
- Discussion
- Conclusions
- Acknowledgements
- References
Executive summary
This study assessed spatial trends in abundance, biomass and size structures of pipis at Venus Bay to investigate the status of the pipi stock and assess impacts from recreational fishing. A preliminary investigation of the impacts of environmental factors on pipi abundance was also undertaken.
Three monthly surveys were undertaken in Venus Bay during the Australian winter/spring in 2011. Each survey sampled the beach area from Point Smythe to 10 Mile Creek, consisting of 20 transects spaced 1 km apart. Abundance, shell length, weight and age class of pipis were documented. Environmental characteristics including beach slope, sediment moisture content and sediment grain size were also evaluated.
Spatial trends in biomass and abundance of mature pipi suggest that the impacts of recreational harvest are localised i.e. within 3 km of beach access points. Abundance (nos of pipis/transect) and biomass (kg/transect) were lowest in transects located within 3 km of beach access points and greatest in transects located further (>3 km) from access points. Importantly, size structures of pipi from adjacent (< 3km) to beach access points had few mature pipis while those further (>3 km) from access points had both immature and mature pipis present.
Results of this study suggest that the pipi resource in Venus Bay is currently harvested at a sustainable level. However, because the impacts of fishing are localised the introduction of new access points in Venus Bay may have implications on stock levels, particularly the abundance of mature pipis.
Introduction
Donax (Plebidonax) deltoides, known as the Goolwa cockle (South Australia) or pipi (eastern Australian states) is a bivalve surf clam native to Australian surf beaches. The pipi can constitute up to 85% of the total benthic in-faunal biomass of high energy surf beaches in eastern Australia and can play an important role in nutrient cycling by removing plankton from the water column through filter feeding (Ansell, 1983).
Surf clam populations are naturally variable and environmental factors can play an influential role in regulating stock levels. Large spatial and temporal variations in recruitment, settlement and distribution are common (Mc Lachlan et al. 1996). Variation can be the product of a range of factors including: ocean current behaviour (Scheltema, 1971); coastline geography (Gimenez and Yannicelli, 2000); sediment moisture content (Hacking, 1998); sediment grain size (Schoeman and Richardson, 2002); beach slope (Hacking, 1998); and wind, wave and tidal movements (Bonsdorff and Nelson, 1992).
The collection of surf clams for human consumption and medicinal uses dates back to ancient Greece (Voultsdou et al., 2010). Pipi harvest for food and trade by indigenous Australians predates European settlement (Godfrey, 1989). More recently, surf clams including pipis, have become an increasingly popular source of food and bait with research showing harvest has the capacity to effect stock abundance and size structure (Mc Lachlan et al. 1996).
Surf clams fisheries are prone to over exploitation and stock decline has been documented in commercial and recreational fisheries in Europe, North America, South America, Asia and New Zealand (Mc Lachlan et al. 1996).
In Australia, pipis are harvested in a recreational and a commercial capacity. Commercial and recreational fisheries co-exist in New South Wales (NSW) and South Australia (SA) (Murray-Jones and Steffe, 2000; Murray-Jones and Johnson, 2003; Ferguson and Mayfield, 2006). Declines in commercial catch have been observed in both state fisheries (Murray-Jones and Steffe, 2000; Murray-Jones and Johnson, 2003; Ferguson and Mayfield, 2006). In SA, the total annual catch of pipis has declined from a peak in the 2000/01 season largely due to fishing pressure (Ferguson and Mayfield, 2006). In NSW, significant declines in commercial catch have resulted in the closure of the fishery (NSW Fishing and Aquaculture, 2012).
In Victoria, recreational pipi harvest occurs in the absence of a commercial fishery. In 2001, the National Recreational and Indigenous Fishing Survey estimated the number of pipis caught that year to be 638,704 (Henry and Lyle, 2003). This study forecast future growth in recreational fishing participation (Henry and Lyle, 2003).
The majority of recreational pipi harvest in Victoria occurs at two locations; Discovery Bay (west Victoria) and Venus Bay (east Victoria). Harvest is managed using recreational fishing licenses (RFL), equipment restrictions (no tools; hands and feet only) and daily catch limits (DCL). In 2009, anecdotal evidence of increasing recreational pipi harvest at Venus Bay led to the local reduction of the DCL from 5 L to 2 L to reduce potential impact on stock levels.
A study was subsequently undertaken in Venus Bay to provide preliminary data on stock levels and assess the impacts of recreational harvest on pipi stock levels. Conducted from November 2009 to February 2010, this study found that pipi biomass and the proportion of mature pipis declined at areas adjacent to beach access points (Lewis and Scarpaci, 2010). Further information on the spatial extent of pipi abundance and the effects of recreational harvest on biomass is needed to inform management arrangements.
This aims of this study were to investigate:
- the status of pipi stock in Venus Bay;
- the impacts of recreational fishing; and
- potential environmental factors that may affect abundance of pipi.
To achieve this we analysed (i) relative abundance (ii) biomass and (iii) length frequency distribution data from fishery independent surveys and (iv) compared relative abundances with environmental data.
Methods
Study site
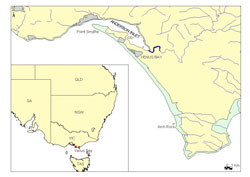
Venus Bay is located approximately 170 km from Melbourne on the south-east coast of Victoria, Australia (Figure 1). Venus Bay is a large south-west facing bay exposed to high energy wave action with a wide intertidal margin that provides ideal habitat for pipis (King, 1976; Ansell, 1983)
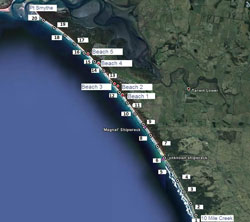
Public access is limited to the north-west corner of Venus Bay along public beaches 1-5 situated within Cape Liptrap Coastal Park (Figure 2). These beaches include car park facilities, public toilets and are popular swimming locations. Beach 1 is the most frequented beach due to the presence of a surf lifesaving patrol. Sampling was undertaken in the area between Point Smythe and Arch Rock (Figure 1).
Biological sampling
Sampling consisted of 3 surveys conducted monthly from August to October 2011. Each survey consisted of 20 transects which ran perpendicular to the shoreline and were positioned at 1 km intervals along the beach, starting at 10 Mile Creek and extending to Point Smythe (Figure 2). No sampling was undertaken south-east of 10 Mile Creek due to a reduced intertidal margin and exposed rocky platforms which was a result of extreme weather conditions. To ensure accurate replication of sampling, GPS coordinates were marked for each transect.
The sampling methodology was adapted from Lewis & Scarpaci (2010). Transects extended 40 m from the mean high water mark (MHWM) into the swash zone and consisted of 9 quadrats spaced at 5 m intervals. Each box quadrat was 0.3 m x 0.3 m and isolated sediment to a depth of 0.2 m. Quadrats were classified by tidal zone, based on their distance from the MHWM. Each tidal zone sample consisted of 3 quadrats as follows:
- low-tide zone (30 – 40 m MHWM);
- mid-tide zone (15 – 25 m from MHWM); and;
- high-tide zone. (0 – 10 m from MHWM).
Sand was excavated from each quadrat and filtered through a 2 mm sieve using seawater to separate pipis from the sediment. The 2 mm mesh size provided a sufficiently wide representation of size classes present in the sample (Schlacher et al., 2008).
The total number of pipis per tidal zone (no.tz-1) was calculated as the number of pipis found in each quadrat within that tidal zone. The total number of pipis per transect (no.ts-1) was calculated from the number of pipis found in each tidal zone within that transect.
The shell length of individual pipis was measured to the nearest 0.1 mm using Vernier callipers. As local size-at-maturity data was unavailable, pipis were classified into two length based maturity classes adapted from those used in an assessment of the NSW commercial and recreational pipi fishery (Murray-Jones and Steffe, 2000); mature (≥37 mm) and immature (<37 mm).
The wet weight of each pipi was measured using digital scales to the nearest 0.1 g. Biomass was calculated as the density of sampled pipi weight (kg) across the area of beach sampled and standardised to 1 m2 (kg.m2).
Environmental sampling
At each transect, the beach slope, sediment moisture content and sediment grain size were measured.
Beach slope was measured during the October survey using an inclinometer and was recorded to the nearest 0.1º using the prescribed method of Zinn (1969).
Sediment sampling occurred during the August survey. At each transect, three sediment samples were taken; one from each tidal zone. Sediment samples were obtained using a T-Bar soil sampler with an 18 mm diameter. The T-bar sampler was inserted to a depth of 0.2 m, consistent with surf clam habitat (Schlacher et al., 2008). Samples were placed in a sealed bag and analysed at the Victoria University laboratory.
Sediment samples were weighed using fixed digital scales to the nearest 0.01 g. Samples were oven dried at 80ºC for 24 hours. In some instances, a further 12 hours of drying was necessary for samples which failed to dry within the 24 hour time frame. Post drying, samples were again weighed and moisture content calculated as the difference in weight before and after drying.
The Wentworth scale was used to grade each sediment sample based on particle grain size and composition (Wentworth, 1922) (Table 1).
| Grading Name | Sediment size (mm) |
|---|---|
| Very coarse sand | 2-1 |
| Coarse sand | 1-0.05 |
| Medium sand | 0.5-0.25 |
| Fine sand | 0.25-0.125 |
| Very fine sand | 0.125-0.0625 |
Statistical analysis
Analyses of abundance and size structure
Multiple Two-way Analysis of Variance (Repeated Measures; α = 0.05) was used to detect spatial differences in abundance and biomass (Quinn and Keough, 2002). Post-hoc Tukey Tests were used to determine where, if any, spatial differences occurred.
The first ANOVA assessed differences in total, mature and immature abundance (no.ts-1) and biomass (kg.m2) between transects (20 levels: transect 1- 20). The second ANOVA assessed differences in total, mature and immature abundance (no.tz-1) and biomass (kg.m2) between tidal zones within transects (3 levels: tidal zone 1-3).
A paired samples T-Test was used to detect differences in mean abundance (no.ts-1), and total biomass (kg.m2) between sampling period.
Three size frequencies were generated to compare size structure across the fishery: the first included the whole sampled population; the second included samples from within areas ≤ 3 km from beach access and; the third included samples from areas > 3 km from beach.
Analyses of environmental parameters
Beach slope (degrees), sediment moisture content (%) and the proportion of sediment grade size (%) were each compared among transects (as above) using individual one-way ANOVAs (α = 0.05).
Results
Pipi demographics
Abundance
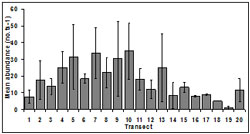
Abundance was spatially variable among transects. Mean abundance decreased from transect 13 (25.00 ± 20.41 no.ts-1) to transect 19 (1.00 ± 1.73 no.ts-1) which occur within 3 km for beach access points i.e. the area accessible to harvesters (beaches 1-5). The smallest mean abundance occurred in transect 19 (1.00 ± 1.73 no.ts-1) and the largest mean abundance was at transect 10 (35.00 ± 29.21 no.ts-1) (Figure 3). There was no significant difference in abundance among transects (p = 0.07).
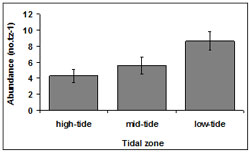
The mean abundance among tidal zones was variable throughout Venus Bay. The highest abundance of 9.22 ± 4.95 no.tz-1 occurred in in the low-tide zone. Abundances of 8.48 ± 3.98 no.tz-1 and 8.31 ± 4.89 no.tz-1 occurred in mid-tide and high-tide zones respectively tz (Figure 4). Across all transects, the highest numbers of pipis were found within the low-tide zone. A total of 51.28% of pipis were present in the low-tide zone, 32.31% in the mid-tide zone 2 and 16.40% in the high-tide zone 3.
Overall, the abundance of pipis differed among tidal zones (p < 0.01). Post-hoc Tukey tests indicated a significant difference between tidal zone 2 and the other tidal zones (p = 0.04).
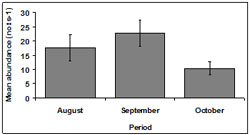
Abundance fluctuated across the sampling period. Mean abundance was lowest in October (10.35 ± 2.30 no.ts-1) and highest in September (22.7 ± 4.51 no.ts-1). Abundance was 17.55 ± 4.49 no.ts-1 in August (Figure 5).
There was a significant difference detected in abundance between months (p < 0.01). October demonstrated a significantly lower abundance than other months.
Biomass
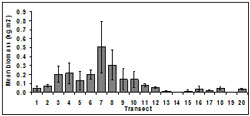
Biomass was variable among transects and months and ranged from 0.1 to 1.06 kg.m2. The highest mean biomass occurred at transect 7 (0.51 ± 0.29 kg.m2) and the lowest occurred at transect 14 (<0.01 ± 0.01 kg.m2) (Figure 6). Biomass was lowest at transects in close proximity to beach access, i.e. transect 11-19.
Overall, biomass differed among transects (p < 0.01). Biomass at transects 7 and 8 were significantly higher than for other transects.
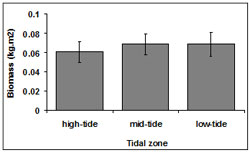
Biomass was consistent among tidal zones (Figure 7). However, there was a small difference in mean biomass between the low-tide (0.07 ± 0.01 kg.m2) and mid tide zones (0.07 ± 0.01 kg.m2) with a slight decline in the high-tide zone (0.06 ± 0.01 kg.m2). There was no significant interaction between tidal zone and transect (p = 0.62).
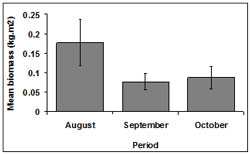
Among months, biomass was highest during August (0.18 ± 0.06 kg.m2). Biomass was lower in October (0.09 ± 0.03 kg.m2) and September (0.08 ± 0.02 kg.m2) (Figure 8).
Overall, biomass differed between October and September (p < 0.01) and between August and September (p < 0.01). In both cases biomass during September was significantly lower.
Size structure

Figure 9: Size frequency of shell lengths (mm). Note for the purposes of the graph scale, the spike in frequency at 5 mm has been reduced (actual number is 285).
For all samples combined sizes of pipis ranged from <5- 80 mm with a number with modes at <5 mm, 10-15 mm and 37-40 mm (n = 1012) representing several cohorts. The majority of pipis were below 30 mm in length and 27.9% were less than 5 mm in length. Pipis less than 5 mm in length were the dominant modal size class (Figure 9).
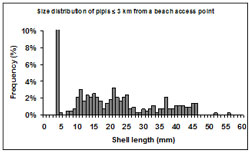
Figure 10: Size frequency (%) of shell lengths (mm) sampled at transects 3 km or less from a beach access point. Note for the purposes of the graph scale, the spike in frequency at 5 mm has been reduced (actual number is 46.5%).
The size structure of pipis sampled at transects located 3 km or less from beach access points were dominated by small immature individuals (Figure 10). Size distributions from these areas were bimodal with modes at <5 mm and 21 mm length. The most significant mode occurred at <5 mm consisting of 46.5% of the sampled pipis. There was no mode representing mature individuals in these areas.

Figure 11: Shell length (mm) frequency (%) of pipis sampled at transects greater than 3 km from a beach access point. Note for the purposes of the graph scale, the spike in frequency at 5 mm has been reduced (actual number is 15.7%).
For size structures from transects located more than 3 km from beach access points a mode representing mature individuals was also present. (Figure 11). Size structures from these areas were tri-modal with modes at <5 mm, 10-15 mm and 37-40 mm. The most significant mode occurred at < 5 mm and comprised 15.7% of samples.
Maturity
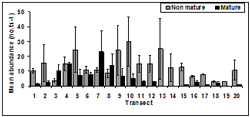
Of all pipis sampled 70.95% were classified as immature with the remaining 29.05% classified as mature (n=1012) (Figure 12). The abundance of mature pipis was highest at transect 7 (23.00 ± 14.29 no.ts-1) and decreased towards Point Smythe (transect 20). There were no mature pipis observed at transect 13, 14 and 19 which were located less than 3 km from beach access points.
The abundance of immature pipis peaked at transect 10 (30.00 ± 16.77 no.ts-1) with immature pipis evident at each transect across the entire sampling period.
A significant difference in the number of mature pipis was detected between transects (p < 0.01). The abundance of mature pipis was significantly higher at Transect 7 (p > 0.01) compared to other transects. There was no significant difference in the number of immature pipis between transect (p = 0.18).
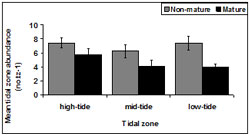
Non- mature abundance was consistent across tidal zone (Figure 13). There was a significant difference in mature pipis detected between tidal zones (p = 0.03). Tidal zone 1 accounted for the highest number of mature pipis.
There was a significant difference in immature pipis detected among tidal zones (p < 0.01). Tukey testing demonstrated the number of immature pipis in tidal zone 2 (p = 0.02) was significantly larger than tidal zone 3 and significantly less than tidal zone 1.
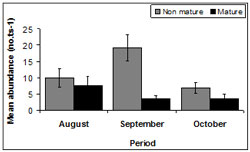
There was fluctuation in maturity throughout sampling periods (Figure 14). The highest mean abundance for immature pipis occurred during September (128 ± 94.27) followed by August, (67 ± 16.65) with the smallest mean abundance during October (45 ± 18.15). The highest mean abundance for mature pipis was documented in August (50 ± 15.04) followed by October, (24 ± 27.06) and September (23 ± 22.59).
There was no difference in the abundance of mature pipis among all sample months (p > 0.05). However, the abundance of immature pipis did differ between August and October (p <0.01) and September and October (p < 0.01). The lowest abundance of immature pipis occurred during October and highest in September.
Environmental parameters
Beach slope
Beach slope was similar among transects (p> 0.05) and ranged between 3 and 8 degrees at all transects assessed.
Sediment moisture content
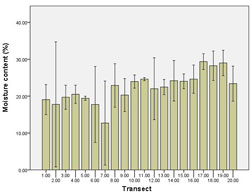
The lowest moisture content of 12.69% was observed at transect 7. All other transects displayed moisture content between 17.73% - 29.36%. Higher levels of moisture content occurred near Point Smythe, with the highest moisture content recorded at transect 19 (29.36%) (Figure 15).
Overall, moisture content differed among transects (p = <0.01). Transect 7 was significantly different from other transects. There was no difference in moisture content among tidal zones (p = 0.27).
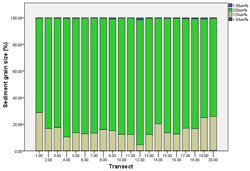
Sediment grain size
A significant difference in sediment grain size was detected among transects (p< 0.05). The mean percentage grain size varied significantly for very course sand (p = 0.02) and very fine sand (p < 0.01) across transects. There were no differences in grain size for fine (p = 0.16) or medium sand (p = 0.15).
The mean percentage of very fine sand at transects 1 (p = 0.01), 14 (p = 0.02), 19 and 20 (p = 0.01) were less than at other transects. The mean percentage of very coarse sand differed between transects 1 (p = 0.04), 2 (p = 0.03), 6 (p = 0.04), 7 (p = 0.01), 8 (p = 0.04), 10 (p = 0.04) and 11 (p = 0.03).
The most common sediment sizes were medium and fine sand at all transects. Medium sand was most common (83.71%), followed by fine sand (15.76%) and very coarse sand (0.43%) (Figure 16).
Discussion
Information available for assessing stock status
This study provides an assessment of the status of the pipi stock in Venus Bay. This was achieved by investigating spatial trends in abundance, biomass and size structures of pipis. A preliminary investigation of the impacts of environmental factors on pipi abundance was also undertaken.
Data from this study were taken from Venus Bay during winter/spring in 2011 and supplement a previous assessment of the Venus Bay pipi stock conducted during the summer of 2009/10 (Lewis and Scarpaci 2010).
Other information relevant to the assessment includes the preliminary assessment of abundance, size and population genetic structure in south-west Victoria (Versace et al., 2011) and the National Recreational and Indigenous Fishing Survey (Henry and Lyle, 2003).
Current status of Venus Bay pipi fishery
Results from this study indicate that the pipi stock in areas of Venus Bay close to beach access points have been impacted by recreational harvest. Evidence for this includes: (i) a spatial decline in biomass (kg.m2) in public beach areas that are easily accessed by harvesters; and (ii) low abundance of large mature pipis in these areas.
Differences in size structures between areas adjacent to (<3 km) and distant from (>3 km) beach access points support the trends observed in biomass and abundance of mature pipis. As the distance from a public access point increased, so too did levels of biomass and abundance of mature pipis. This effect was observed within approximately 3 km of an access point which is likely the maximum distance the majority of harvesters are willing to travel on foot for their catch.
Results of this study are supported by assessments of recreational fisheries in NSW (Murray-Jones and Steffe, 2000) and South Africa (Schoeman, 1996) which have shown that recreational harvest/effort is commonly clustered around beach access. The limited spatial extent of differences in size structures indicates this trend is likely also the case in Venus Bay.
In this study, abundance was highly variable across the beach and over the sampling period. Mean abundances for individual transects were generally below 50 no.ts-1 and were consistent with levels observed in the 2009/10 survey (Lewis and Scarpaci, 2010). There was no substantial change in abundances between this study and those observed in 2009/10. It is unlikely that harvest has had a detectable effect on abundance in this time.
Like abundance, biomass was highly variable among transects and across the sampling period. Lower biomass was observed in areas adjacent to beach access (transects 12-19) indicating local depletion in those areas most accessible to harvesting by recreational fishers.
There was no significant change in biomass observed in this study and the study in 2009/10 (Lewis and Scarpaci, 2010). Lewis & Scarpaci (2010) hypothesised that biomass levels (approximately 0.2-0.5 kg.m2) reported at the control site (located 5 km south-east from beach 1) were representative of a healthy stock that was located outside of easily accessible areas which are exposed to high levels of harvest. It is likely the levels of biomass observed >3 km from beach access points are within a naturally occurring range as a result of low levels of harvesting.
There was a clear difference in size structures of pipi between areas less than 3 km from a beach access point and those further than 3 km. Size structures from within 3 km of access exhibited a pronounced mode of small, immature pipis consistent with an exploited population (Murray-Jones and Steffe, 2000). There were few large mature pipis (> 37 mm shell length) in these areas reflecting the preference for larger pipis by harvesters (Murray-Jones and Steffe, 2000; Hartill et al., 2005).
Hartill et al. (2005) hypothesised that the removal of mature pipis could have an effect on the reproduction capacity within a fishery and reduce resilience to fishing pressure. This scenario is unlikely in this fishery. Stock in areas further than 3 km from access were multi-modal with a clear mature size cohort (37-40 mm) consistent with results from 2009/10 (Lewis and Scarpaci, 2010). This result indicates a refuge from harvest is created by a lack of beach access. In the south-east areas of Venus Bay this is allowing pipis to survive and grow through to reproductive age evidenced by the high abundance of large, mature pipis.
The presence of significant numbers of immature pipis at all transects sampled in 2009/10 and 2011 suggests that reproduction and recruitment has occurred throughout the spatial extent of the fishery. Small pipis (<5 mm shell length), while abundant in this study were not observed by Lewis & Scarpaci (2010) in the spring/summer of 2009/10 despite consistent sampling methodology. The different results between the to studies may be attributed to differences in sampling season and the rapid shell growth from the pelagic larval stage within the sediment during summer (King, 1976), or inter-annual differences in the level of recruitment.
At transect 20 (Point Smythe) a large mode of immature pipis was observed. Sampling occurred during the winter/spring, a known spawning period (Murray-Jones and Johnson, 2003). This result may represent the onset of settlement after a peak recruitment period. Research has shown that freshwater flows can act as spawning cues in surf clam populations (Murray-Jones and Johnson, 2003; Ferguson and Mayfield, 2006). The location of Anderson Inlet to the north of Venus Bay may provide nutrients that contributes to spawning/recruitment success in this area. Pipis may initially recruit at Point Smythe and then passively migrate with the westerly winds, wave and tidal movements (Bonsdorff and Nelson, 1992) along Venus Bay towards Arch Rock. Further research is required to confirm this hypothesis.
There were few mature pipis found in the Point Smythe area. Reduced salinity has been shown to impact the survival, condition and burial of bivalves (Matthews, 2004). Low salinity may have resulted from large freshwater flows during flooding events that took place in late April 2011. However, it is more likely that the trends in abundance, biomass and size structures observed in this study reflect the impact of recreational harvest due to the low abundance of mature pipis in this area. Additionally, larger pipis are able to burrow deeper into the sediment reducing the chances of tidal and longshore migration (1977). This trait could reduce immigration of mature pipis from adjacent areas and this would intensify the effects of harvest.
Beach morphodynamic characteristics
Environmental conditions may influence surf clam populations (Hartill et al., 2005) but are rarely included in stock assessment. Several studies (Sastre, 1984; James and Fairweather, 1996; Hacking, 1998; de la Huz et al., 2002) have indicated that beach morphodynamic characteristics can be key drivers in surf clam abundance.
This study assessed three beach morphodynamic features; beach slope, sediment moisture content and sediment grain size. There was no significant spatial change evident in beach slope or sediment grain size across the sampling area. These characteristics were consistent with an intermediate beach which exhibit high wave energy, medium slope gradient and medium grain size (Hacking, 1998).
The percentage of moisture content showed some variability, with the moisture content at transect 7 significantly lower than all other transects. As expected given the influence of Anderson Inlet to the north of the study area, moisture content increased slightly towards Point Smythe.
Previous research identified moisture content as a limiting factor for migration in surf clam populations of Donax striatus in Trinidad (Wade, 1967) and Donax serra in South Africa (Donn and Clarke, 1986). Cardoso & Veloso (2003) suggest that the distribution of smaller surf clams were more sensitive to environmental changes than larger surf clams. The distribution of small, immature pipis throughout the study area indicates moisture content is not a limiting factor in Venus Bay.
The beach morphodynamics assessed in Venus Bay are consistent across the majority of the beach area sampled. These factors appear to exert little influence on pipi abundance with few environmental barriers to settlement and distribution along the extent of the coastline studied. This result increases the likelihood that changes in abundance and size structure observed close to beach access are the result of recreational harvest.
Assessment limitations
The impacts of recreational harvest are inferred based on the results of this study in comparison with results from the 2009/10 study. Temporal trends in levels of recreational catch/effort have not been defined, in particular whether recreational effort is increasing. Further, there is no estimate of the size-at-maturity of pipi in Venus Bay or intra/inter annual patterns of recruitment.
Future research needs
Ideally future research would include assessment of size-at-first-maturity and intra-annual trends in reproductive development and recruitment. Additionally management of the pipi resource in Venus Bay would benefit from periodic monitoring (i.e. each 5 years) of population demography including relative abundance, biomass and size distributions.
Research that documents intra/inter annual patterns in recreational catch and effort (across at least one annual cycle i.e. four seasons) would further enable adaptive future management strategies to be implemented.
Management Implications
Results of this study show that impacts of recreational harvest are predominantly restricted to areas close to beach access points. However, the introduction of additional access points may increase the impact of harvest on the pipi stock levels over a larger spatial scale.
For areas close to beach access points biomass and abundance of mature pipis are lower than in those areas remote (>3 km) from beach access points. Similarly, large, mature pipi are poorly represented in size structures from areas close to beach access points. Consequently, continued monitoring and assessment of biomass and size structures is essential to inform sustainable management of the pipi resource if the number of access points onto the Venus Bay coastline were increased.
At distances greater than 3 km from beach access points high levels of abundance and biomass indicate a healthy, mature population. Additionally for these areas, multi-modal size structures indicated a high proportion of mature pipis and the presence of immature recruits to the fishery.
Currently reduced daily catch limits should be maintained, with the view to regularly review and adapt management to ensure a sustainable fishery.
Conclusions
This study investigated spatial trends in abundance, biomass and size structures of pipis at Venus Bay to assess the status of the pipi stock and potential impacts of recreational fishing. A preliminary investigation of the impacts of possible environmental factors on pipis was also undertaken.
Results of this study indicate:
- the effect of recreational harvest is localised within approximately 3 km of access points;
- beach access points strongly influence the location of recreational harvest activity;
- the potential exists for declines in pipi biomass and size structure if new access points are introduced;
- there are few large, mature pipis in areas of Venus Bay located near beach access points;
- there is evidence of a healthy mature population in areas more than 3 km from access; and
- the current management framework, including the reduced bag limit, should be reviewed and adapted based on future research i.e. monitoring of spatial extent of recreational harvesting.
Acknowledgements
This project was completed as part of an Honours Thesis to fulfil the requirements of an Honours Degree in Applied Biology, through the Unit of Ecology and Sustainability, School of Health Engineering and Science, Victoria University.
This project was funded by the Victorian Government using Recreational Fishing Licence fees. In addition, the authors would like to express their gratitude to Jonathon Stevenson from Parks Victoria for his assistance and knowledge of Cape Liptrap Coastal Park.
References
Ansell, A., 1983. The biology of the genus Donax. In: McLachlan, A., Erasmus, T. (Eds.), Sandy Beaches as Ecosystems W Junk, The Hague, pp. 607 - 635.
Bonsdorff, E., Nelson, W.G., 1992. The ecology of coquina clams Donax variabilis Say, 1822, and Donax parvula Philippi, 1849, on the east coast of Florida. . The Veliger 35.
Cardoso, R., Veloso, V., 2003. Population dynamics and secondary production of the wedge clam Donax hanleyanus (Bivalvia: Donacidae) on a high-energy, subtropical beach of Brazil. Marine Biology 142, 153-162.
de la Huz, R., Lastra, M., López, J., 2002. The influence of sediment grain size on burrowing, growth and metabolism of Donax trunculus L. (Bivalvia: Donacidae). Journal of Sea Research 47, 85-95.
Donn, J.R.T., Clarke, D.J., 1986. Distribution and abundance of Donax serra Röding (Bivalvia: Donacidae) as related to beach morphology. Journal of Experimental Marine Biology and Ecology 102, 121-131.
Ferguson, G., Mayfield, S., 2006. The South Australian Goolwa cockle (Donax deltoides) fishery. Report Series 150. South Australian Research and Development Institute, Adelaide, pp. 1-30.
Gimenez, L., Yannicelli, B., 2000. Longshore patterns of distribution of macro-infauna on a Uruguayan sandy beach: an analysis at different spatial scales and of their potential causes. Marine Ecology Progress Series 199, 111-125.
Godfrey, M.C.S., 1989. Shell midden chronology in southwestern Victoria: reflections of change in prehistoric population and subsistence? Archaeology in Oceania 24, 65-69.
Hacking, N., 1998. Macrofaunal community structure of beaches in northern New South Wales, Australia. Marine and Freshwater Research 49, 47-53.
Hartill, B., Cryer, M., Morrison, M., 2005. Estimates of biomass, sustainable yield, and harvest: neither necessary nor sufficient for the management of non-commercial urban intertidal shellfish fisheries. Fisheries Research 71, 209-222.
Henry, G., Lyle, J., 2003. The national recreational and Indegenous fishing survey. FRDC Project 99/158. Department of Agriculture, Fisheries and Forestry, Canberra.
James, R., Fairweather, P., 1996. Spatial variation of intertidal macrofauna on a sandy ocean beach in Australia. Estuarine, Coastal and Shelf Science 43, 81-107.
King, M.G., 1976. The life history of the Goolwa cockle Donax (Plebidonax) deltoides (Bivalvia: Donacidae), on an ocean beach, South Australia. Fisheries Internal Report. Fisheries Branch, South Australian Department of Agriculture, Adelaide.
Lewis, Z., Scarpaci, C., 2010. Recreational harvest: implications on management and sustainability of the pipi (Donax deltoides) at Venus Bay, Victoria. Fisheries Victoria Final Report. Department of Economic Development, Jobs, Transport and Resources (former) Department of Primary Industries, Melbourne.
Matthews, T.G., Fairweather, P.G 2004. Effect of lowered salinity on the survival, condition and reburial of Soletellina alba (Lamarck, 1818) (Bivalvia: Psammobiidae). Austral Ecology 29, 250-257.
McLachlan, A., 1977. Composition, distribution, abundance and biomass of the macrofauna and meiofauna of four sandy beaches. South African Journal of Zoology 12, 279-306.
Murray-Jones, S., Johnson, J., 2003. Goolwa Cockle (Donax deltoides). South Australian Fisheries Assesment Series 2002/21. South Australian Research and Development Institute, Adelaide, pp. 1-56.
Murray-Jones, S., Steffe, A., 2000. A comparison between the commercial and recreational fisheries of the surf clam, Donax deltoides. Fisheries Research 44, 219-233.
NSW Fishing and Aquaculture, 2012. Harvest changes to help secure pipi stocks. NSW Department of Primary Industries, Sydney.
Quinn, G., Keough, M., 2002. Experimental Design and Data Analysis for Biologists. Cambridge University Press, UK.
Sastre, M.P., 1984. Relationships between environmental factors and Donax denticulatus populations in Puerto Rico. Estuarine, Coastal and Shelf Science 19.
Scheltema, R.S. (Ed), 1971. The dispersal of the larvae of shoal-water benthic invertebrate species over long distances by ocean currents.
Schlacher, T., Schoeman, D., Dugan, J., Lastra, M., Jones, A., Scapini, F., McLachlan, A., 2008. Sandy beach ecosystems: key features, sampling issues, management challenges and climate change impacts. Marine Ecology 29, 70-90.
Schoeman, D., 1996. An assessment of a recreational beach clam fishery: Current fishing pressure and opinions regarding the initiation of a commercial clam harvest. South African Journal of Wildlife Research 26, 160-170.
Schoeman, D., Richardson, A., 2002. Investigating biotic and abiotic factors affecting the recruitment of an intertidal clam on an exposed sandy beach using a generalized additive model. Journal of Experimental Marine Biology and Ecology 276, 67-81.
Versace, V.L., Matthews, T.G., Miller, A.D., Bowie, K., Ierodiaconou, D., Mills, D., Lewis, Z., 2011. A preliminary assessment of the abundance, size and population genetic structure of pipis (Donax deltoides), with specific reference to south west Victoria. Recreational Fishing Grants Program Research Report. Department of Economic Development, Jobs, Transport and Resources (former) Department of Primary Industries, Melbourne.
Voultsdou, E., D, K., Achparaki, M., 2010. Bivalve mollusc exploitation in Mediterranean coastal communities: An historical approach. Journal of Biological Research-Thessaloniki 12.
Wade, B.A., 1967. Studies on the biology of the West Indian beach clam Donax denticulatus Linne. Ecology Bulletin of Marine Science 1, 149-174.
Wentworth, C.K., 1922. A scale of grade and class terms for clastic sediments. The Journal of Geology 30.
Zinn, D., 1969. An inclinometer for measuring beach slopes. Marine Biology 2, 132-134.