Statewide Angler Diary Program 1997 - 2003
Figures 11 - 20
Figure 11. Estimated mean total catch rate (± 2 s.e.) of snapper by anglers contributing to the Fishing Diary Program who targeted snapper in Western Port (1998-2003).
Figure 12. Estimated mean retained catch rate (± 2 s.e.) of snapper by anglers contributing to the Fishing Diary Program who targeted snapper in Western Port (1998-2003).
Figure 13. Estimated snapper release rate (± 2 s.e.) by anglers contributing to the Fishing Diary Program who targeted snapper in Western Port (1998-2003).
Figure 14. Estimated snapper release rate (± 2 s.e.) by anglers contributing to the Fishing Diary Program who targeted King George whiting in Western Port (1998-2003).
Figure 15. Size composition of all snapper caught (both retained and released) by anglers contributing to the Fishing Diary Program who fished in Western Port from 1998 to 2003 (n=number of fish measured).
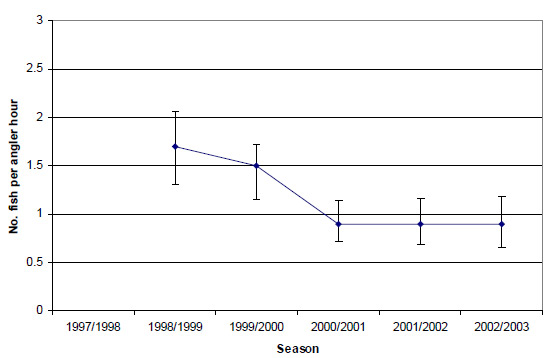
Figure 16. Estimated mean total catch rate (± 2 s.e.) of King George whiting by anglers contributing to the Fishing Diary Program who targeted King George whiting in Port Phillip Bay (1997-2003).
Figure 17. Estimated mean retained catch rate (± 2 s.e.) of King George whiting by anglers contributing to the Fishing Diary Program who targeted King George whiting in Port Phillip Bay (1997-2003).
Figure 18. Estimated mean release catch rate (± 2 s.e.) of King George whiting by anglers contributing to the Fishing Diary Program who targeted King George whiting in Port Phillip Bay (1997-2003).
Figure 19. Size composition of all King George whiting caught (both retained and released) by anglers contributing to the Fishing Diary Program who fished in Port Phillip Bay from 1997 to 2003 (n=number of fish measured).
Figure 20. Estimated mean total catch rate (± 2 s.e.) of King George whiting by anglers targeting King George whiting in Western Port (1998-2003).
Figure 11
Estimated mean total catch rate (± 2 s.e.) of snapper by anglers contributing to the Fishing Diary Program who targeted snapper in Western Port (1998-2003).
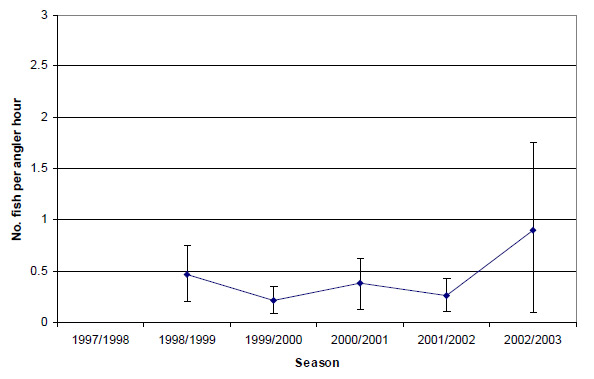
Figure 12
Estimated mean retained catch rate (± 2 s.e.) of snapper by anglers contributing to the Fishing Diary Program who targeted snapper in Western Port (1998-2003).
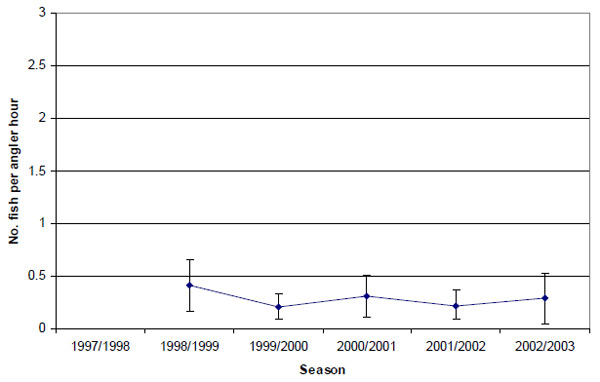
Figure 13
Estimated snapper release rate (± 2 s.e.) by anglers contributing to the Fishing Diary Program who targeted snapper in Western Port (1998-2003).
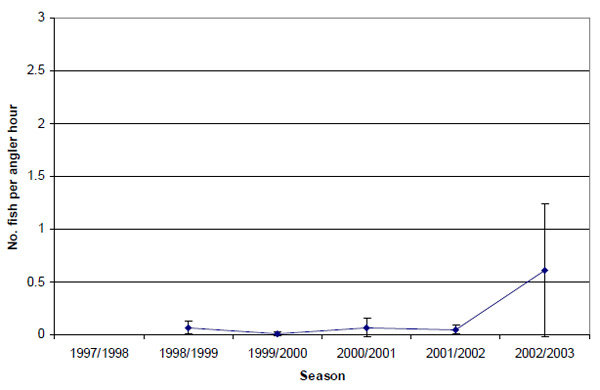
Figure 14
Estimated snapper release rate (± 2 s.e.) by anglers contributing to the Fishing Diary Program who targeted King George whiting in Western Port (1998-2003).
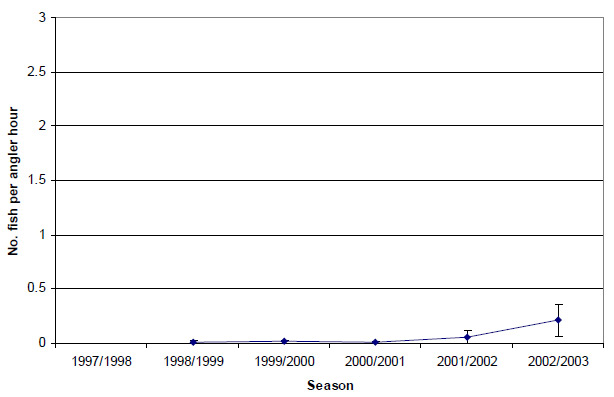
Figure 15
Size composition of all snapper caught (both retained and released) by anglers contributing to the Fishing Diary Program who fished in Western Port from 1998 to 2003 (n=number of fish measured).
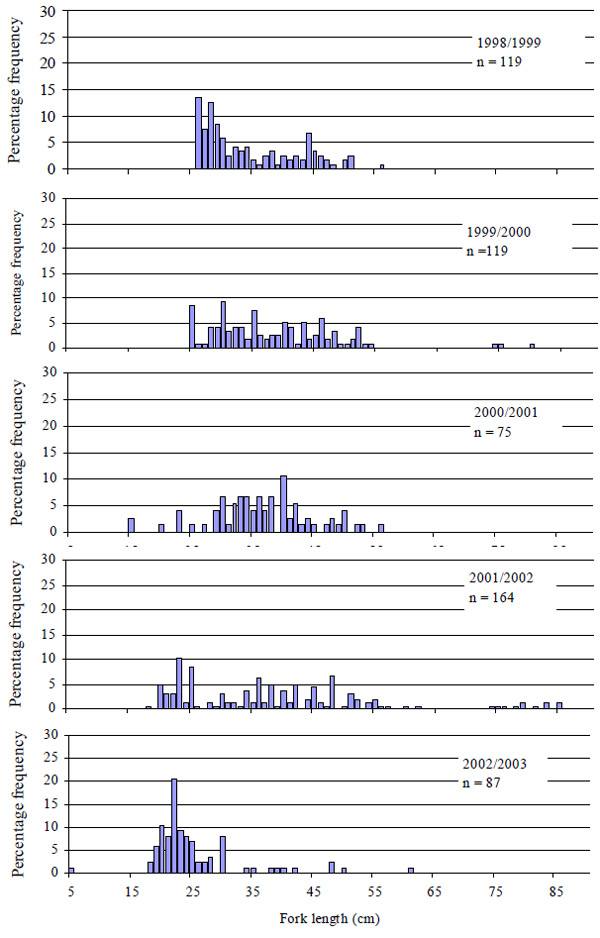
Figure 16
Estimated mean total catch rate (± 2 s.e.) of King George whiting by anglers contributing to the Fishing Diary Program who targeted King George whiting in Port Phillip Bay (1997-2003).
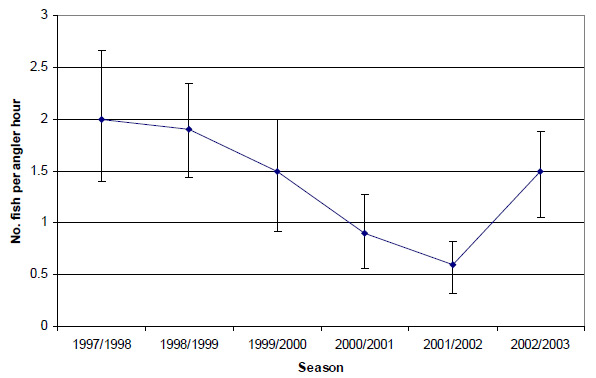
Figure 17
Estimated mean retained catch rate (± 2 s.e.) of King George whiting by anglers contributing to the Fishing Diary Program who targeted King George whiting in Port Phillip Bay (1997-2003).
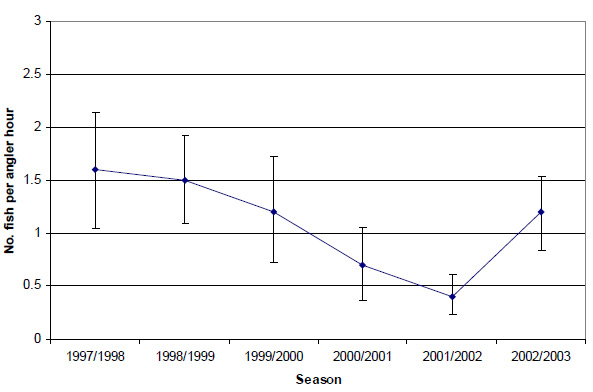
Figure 18
Estimated mean release catch rate (± 2 s.e.) of King George whiting by anglers contributing to the Fishing Diary Program who targeted King George whiting in Port Phillip Bay (1997-2003).
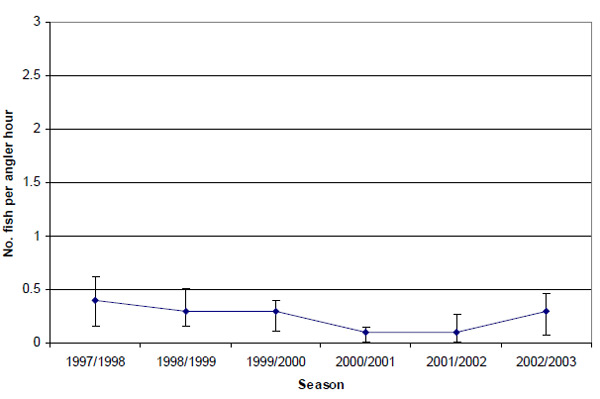
Figure 19
Size composition of all King George whiting caught (both retained and released) by anglers contributing to the Fishing Diary Program who fished in Port Phillip Bay from 1997 to 2003 (n=number of fish measured).
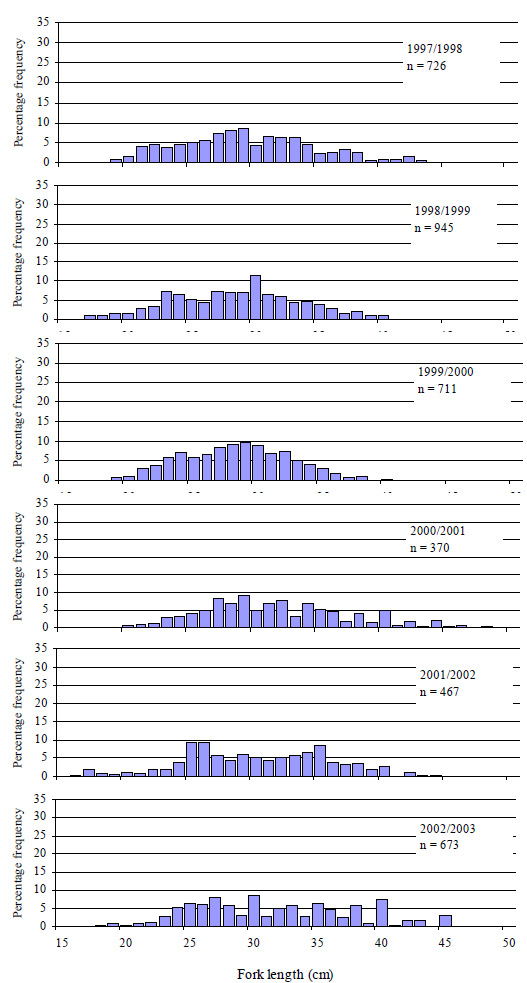
Figure 20
Estimated mean total catch rate (± 2 s.e.) of King George whiting by anglers targeting King George whiting in Western Port (1998-2003).
Back to Statewide Angler Diary Program 1997 - 2003 table of contents