Best Practice Salmonid Aquaculture Industry
Fisheries Management Paper
Fisheries Victoria Report Series No. 25
March 2006
ISSN 1448-1693
ISBN 1 74146 187 1 (internet)
Preferred way to cite this publication:
Department of Primary Industries (2005). Best Practice Environmental Management Guidelines for the Salmonid Aquaculture Industry. Fisheries Victoria Report Series No. 25.
Fiona Gavine, Brendan Larkin, Brett Ingram and Morgan Edwards
Foreword
The salmonid aquaculture industry is a long-established and important contributor to a number of regional th economies in Victoria (e.g. Murrindindi Shire). The Victorian Government is committed to improving the th productivity and environmental sustainability of rural industries such as the aquaculture industry through th its Growing Victoria Together policy (www.growingvictoria.vic.gov.au) and the Victorian Regional
Aquaculture Development Program and the Victorian Agriculture Policy Statements on Aquaculture, 2002. th The Victorian Government also has a commitment to protecting and enhancing water quality in rivers through the Victorian River Health Strategy (Department of Natural Resources and Environment (DNRE), 2002) and the State Environment Protection Policy, Waters of Victoria 2003.
The salmonid aquaculture industry has made substantial gains in environmental management over the last decade and it is pleasing to see that the industry is committed to further improvement. The industry needs to achieve continual improvement in farm management practices, and strive to minimise its impacts on waterways and the broader environment.
These Best Practice Environmental Management Guidelines (BPEMG) are the outcome of a long partnership between industry, the Department of Primary Industries (DPI), the Environmental Protection Authority (EPA) and the Department of Sustainability and Environment (DSE). This BPEMG document has drawn on world's best expertise and integrated this information into a Victorian farming context to assist industry and regulators to improve environmental management in the industry.
This guideline document is not the end of the process, but part of a continuum of improvement. We look forward to improved productivity, a reduced environmental footprint and continued industry growth within sustainable limits.
Peter Appleford
Executive Director
Fisheries Victoria, DPI
Mick Bourke
Chairman
Environmental Protection
Authority
Edward Meggitt
President
Victorian Trout Association
Acknowledgments
This document is the product of two separate projects to develop Best Practice Environmental Management Guidelines (BPEMG) for the Victorian salmonid aquaculture industry.
In 1998, the Aquaculture Program of the Marine and Freshwater Resources Institute (MAFRI) was sub-contracted by the Environmental Protection Authority (EPA) to prepare a draft BPEMG for the freshwater salmonid industry in Victoria. The Healthy Waterways Program of the Department of Natural Resources and Environment (DNRE, now Department of Sustainability and Environment) funded this project. The project team consisted of Brett Ingram of MAFRI, Dr Liam Kelly, Heriot- Watt University, Scotland and Dr Simon Cripps, Rogaland Research, Norway. The Steering Committee for the project consisted of representatives from the EPA, DNRE (including The Victorian Fisheries Authority), Goulburn Murray Water and the Victorian Trout Association (VTA). Although the project team completed a draft BPEMG document, industry and EPA failed to reach a consensus on the scope and content of the guidelines and they were not formally adopted. The critical issue in the failure of the last BPEMG was the prescriptive nature of the final draft, which was at odds with the voluntary and non-prescriptive document that was originally intended.
In 2003, Fisheries Victoria took the lead role in resurrecting the project and commissioned the Aquaculture Section of Primary Industries Research Victoria (PIRVic) to implement it. A small Steering Committee with representatives from EPA, VTA and Fisheries Victoria was formed.
As a starting point the EPA and industry agreed that the BPEMG should remain as a reference document. The aim of the new project was to review, redefine and update the draft BPEMG for formal adoption by the salmonid aquaculture industry and government agencies.
The project team would like to thank Victorian trout farmers for their assistance in conducting the industry audit and the feedback provided on various drafts of this document. In particular, Edward Meggitt of the Victorian Trout Association played a key role in conveying the opinions of the industry to the project team. The contribution of Goulburn Murray Water, Goulburn-Broken Catchment Management Authority, EPA and The Victorian Fisheries Authority in providing comment and guidance is gratefully acknowledged.
Executive Summary
The freshwater salmonid aquaculture industry is an important part of the Victorian aquaculture industry for over 20 years and produces juvenile Afish for restocking rivers as well as market-sized Afish for human consumption. There have been concerns that effluent and other waste streams from salmonid aquaculture can have an impact on the environment in which the farms are located. Salmonid farms are reliant on high quality water and tend to be located in relatively pristine environments. It is important for industry to demonstrate to the wider community that it takes its environmental performance seriously and is operating in a responsible and sustainable manner.
The salmonid aquaculture industry is acutely aware of the environmental issues and community concerns related to the industry. Thus industry is eager to demonstrate that it can produce positive environmental outcomes. There is a heightened awareness at all levels of the industry of the importance of environmental management, as well as the potential improvements in production efficiencies and sustainability that can be made Athrough adopting sustainable practices. The development of BPEMG for the salmonid aquaculture sector will provide a tangible mechanism through which the industry can demonstrate its environmental credentials to the community and continue to grow and improve in the future. These guidelines clearly define best practice environmental management for the Victorian salmonid industry. The guidelines will assist existing industry to develop programs, systems and practices to improve their environmental performance in an affordable, sustainable and efficient way.
A comprehensive survey of the Victorian salmonid industry revealed that the industry currently produces five species: rainbow trout (Oncorhynchus mykiss); brown trout (Salmo trutta); chinook salmon (O. tshawytscha); brook trout (Salvelinus fontinalis); and Atlantic salmon (Salmo salar). There are 22 operational farms, 12 of which are located on the Upper Goulburn system and its tributaries in the north-east of the state. Infrastructure components on Victorian salmonid farms commonly include hatcheries, production units (ponds and raceways), wastewater treatment systems and processing units. Principal inputs to salmonid culture were identified as fish, water, feeds and chemicals and therapeutants.
The waste streams from salmonid culture were identified as the most important source of environmental impacts and provided the basis for development of the BPEMG. Waste streams were identified as:
- organic matter (mainly uneaten feed and fish excreta) in effluent ;
- sludge from settlement ponds;
- chemicals and therapeutants;
- fish mortalities and processing wastes;
- fish escapes; and
- greenhouse gas emissions.
The potential impacts of these waste streams and other farm activities on the aquatic environment, native flora and fauna, humans (in terms of nuisance) and the wider global environment were examined in detail. Best practice measures to reduce and remedy the impacts identified were then documented. .Best practice. was defined in the context of the salmonid aquaculture industry as:
Minimising the waste stream by maximising production efficiency per unit production.
The cornerstone of best practice for all salmonid operations is to comply with all regulatory requirements. Best practice environmental management procedures were developed using the Waste Management Hierarchy where possible to minimise waste streams. In other words, the scope for reducing waste streams through avoidance, recycling or re-using and treatment was analysed so that disposal to the environment was the last resort. Table i shows the waste management hierarchy as it is applied to waste streams from salmonid farming.
Table i: Treatment of waste streams from salmonid aquaculture according to the waste management hierarchy
| Waste stream | Avoidance/ reduction | Re-use/recycle | Treatment | Disposal |
|---|---|---|---|---|
| Organic matter & nutrients in effluent | ||||
| Sludge from settlement ponds | ||||
| Chemicals and therapeutants | ||||
| Fish mortalities and processing wastes | ||||
| Fish escapes | ||||
| Greenhouse gases |
Operational management procedures for other activities that may have environmental impacts were also documented.
Best Practice measures were documented for a range of waste streams:
Organic matter and nutrients in effluent
- Feed management
- Water (oxygen) management
- Use of nutrient mass balance models
- Waste treatment
Settled solids from ponds and treatment facilities
- Minimising sediment production on-farm
- Re-using and recycling of sludge
- Treatment options
- Minimising impacts of disposal
Chemicals and therapeutants
- Minimising the use of chemicals and therapeutants
- Minimising risks of accidents and spills
Fish mortalities and processing wastes
- Reducing mortalities
- Recycling of mortalities and processing wastes (e.g. through composting)
- Disposing of mortalities appropriately and processing wastes
Fish escapes
- Screening of inlet and outlet structures
Greenhouse gas emissions
- Conducting an energy audit and adopting an environmental management plan to reduce energy consumption and increase efficiency
Other environmental issues that could not be addressed using the waste management approach included:
Water abstraction
- Monitoring and managing water flows between inflow and outflow structures
- Employing supplementary aeration or oxygenation to mitigate water demand
- Investigating options for water recycling
Impacts on habitats
- Carrying out all construction with appropriate planning consents
- Receiving an EPA Works Approval for new works
Birds and other predators
- Following guidelines previously developed by the Victorian Trout Association
Visual impacts
- Ensuring litter is kept to a minimum
- Screening site appropriately
Noise
- Muffling noisy machinery
- Complying with EPA country noise guidelines
Odours
- Removing sources of odour quickly
The document also provides guidance on the parameters that should be monitored (in addition to the frequency of monitoring) in order for salmonid farmers to comply with their regulatory responsibilities. This information will allow farmers to monitor the impact of their operations more effectively as well as calculate nutrient mass balance models and oxygen budgets. The use of these two management tools can increase the efficiency with which a farm operates, particularly in terms of feeding efficiency and water management.
The next logical step for salmonid farmers operating at best practice levels is to prepare a site- level Environmental Management System (EMS).
An Environmental Improvement Plan, a type of EMS, is required from all farmers by the EPA as part of their discharge licence. The final section of these guidelines summarises the key elements of an EMS and provides a step-by-step plan for developing one. It is hoped that the adoption of an EMS will provide a tangible mechanism through which the best practice measures identified in this report can be implemented by industry.
The BPEMG document describes a progressive approach to environmental management issues for the Victorian salmonid industry and builds on steps already taken by the industry to integrate economic and environmental objectives.
Introduction
Salmonids are temperate fish and their culture requires access to high quality, relatively cool waters. Salmonid farms are usually located in the headwaters of river systems, or in the upper reaches of regulated rivers where the thermal regime and water flow is conducive to year-round production. In 2003/2004, Victorian production of market sized freshwater salmonids was around 1,637 tonnes, the industry had a farm-gate value of over $12 million per year (Anon, 2004) and accounted for around 85 percent of the total Australian production (Love and Langenkamp, 2003). On a global scale the Australian industry is very small, with Europe alone producing 400,000 tonnes of salmonids per year. The Victorian industry also produces around 0.98 million juveniles for restocking rivers for recreational angling purposes (Love and Langenkamp, 2003).
The salmonid aquaculture industry directly employs around 130 people in rural areas of Victoria (Anon, 2004) and plays a significant role in regional tourism, underpinning the recreational fishing industry in many inland areas of the state. The value of the recreational fishing sector to the Victorian economy has been estimated at around $396 million per year (Henry and Lyle, 2003).
Inland waters in Victoria are lifelines for rural communities and support a variety of agricultural industries and domestic water supplies, as well as being valuable environmental, recreational and aesthetic assets. In recent years, there has been increasing awareness about the need to protect water quality in inland waterways so that they can continue to sustain the ecological values, communities and industries that rely on them. The Victorian Government is committed to achieving healthy waterways through the Victorian River Health Strategy (DNRE, 2002). Indeed, the state environmental protection policy (Waters of Victoria) and its schedules stipulate a number of beneficial uses of surface waters (including aquaculture) that communities want to protect (Victorian Government Gazette, 2003).
Concerns have been raised about the impact of effluent from salmonid aquaculture on the aquatic environment, particularly the potential of nutrients and organic matter in aquaculture wastes to add to other catchment sources of pollution and cause the deterioration of water quality. Nutrients, particularly nitrogen (N) and phosphorus (P) are discharged in effluent from salmonid aquaculture under Environmental Protection uthority (EPA) discharge licences. The EPA is particularly concerned about the impact of nutrients on localised waterway reaches and wants to ensure that beneficial uses of that waterway are adequately protected. Catchment Management Authorities (CMA) in Victoria are actively trying to reduce nutrient loadings from all sources on a catchment basis and, as a result, some have placed a limit on the amount of P that can be discharged. For example, the Goulburn-Broken CMA imposed a P limit of 28.6 tonnes per year on the industry in 1998, based on 1993/94 production data and the use of mass-balance models to calculate P loads from the industry (Ingram, 1999).
The salmonid aquaculture industry has made considerable improvements in environmental management since the benchmarking study in 1993.94 (Ingram, 1999), particularly in terms of nutrient levels in effluent which have been substantially reduced (according to mass-balance estimates) through using higher quality feeds and feeding more efficiently. There is a heightened awareness at all levels within the industry of the importance of environmental management and the potential improvements in production efficiencies that can be made through minimising waste at site level.
The development of Best Practice Environmental Management Guidelines (BPEMG) for the salmonid aquaculture sector will provide a tangible mechanism through which the industry can demonstrate its environmental credentials and continue to grow and improve in the future. Specifically, BPEMG have the potential to offer the following advantages to the salmonid aquaculture industry (Seafood Services Australia, 2002):
- improve economic efficiency through reducing waste at site level;
- demonstrate that organisations within the industry recognise relevant environmental issues and use natural resources in a responsible and sustainable way;
- consolidate good relationships with local communities through perception of industry.s commitment to good environmental performance;
- secure and maintain access to markets, particularly export markets; and
- demonstrate compliance with relevant legislation and regulations.
Objectives of the BPEMG
These guidelines will clearly define best practice environmental management for the Victorian salmonid industry and promote a greater understanding within the industry of the environmental context in which it operates. The guidelines will assist existing industry to develop programs, systems and practices to improve their environmental performance in an affordable, sustainable and efficient way, but recognise that retro-fitting technologies to existing farms may not always be practical or cost-effective. New entrants to the industry will be expected to adopt best practice from the outset.
The guidelines will benchmark existing practices, identify the main environmental issues associated with the industry and outline methods by which impacts may be minimised. A framework for environmental improvement will be developed for the industry, which could be used by individual operators to develop site specific Environmental Improvement Plans (EIP) or Environmental Management Systems (EMS). Specifically, these guidelines will provide information on:
- salmonid farming practices in Victoria including principal inputs and wastes generated, to benchmark current practices;
- the regulatory environment under which the salmonid industry operates;
- potential environmental issues related to the salmonid industry. This section will identify potential impacts of the salmonid industry on the environment as well as the risks to the industry from the environment;
- BPEMG for the salmonid industry detailing measures that will reduce environmental impacts; and
- developing an Environmental Management Systems (including an EIP) for an organisation.
Several appendices are included in this document:
- Appendix 1 contains water quality guidelines for aquaculture production;
- Appendix 2 details the SEPP water quality objectives for rivers and streams in Victoria;
- Appendix 3 considers environmental issues that can be addressed during facility site selection, design and construction; and
- Appendix 4 lists the acronyms and abbreviations used in this document.
These guidelines are intended for use by salmonid farm operators (i.e. producers holding an Aquaculture (Private Land- Salmonids) Licence issued under the Fisheries Act 1995) that produce aquatic products for commercial purposes. This BPEMG is intended solely as a reference document and not as a regulatory instrument or as a basis for approvals, licences or permits. It aims to promote a greater understanding of the diverse environmental considerations required by government agencies that need to be addressed by the salmonid industry.
Freshwater salmonid industry in Victoria
Salmonids are not indigenous to Australia and were first introduced to Victoria in 1864 as part of a massive effort to acclimatise new plant and animal species to the growing colony (Clements, 1988). Early colonists valued salmonids for their sport fishing attributes as well as their nutritional value and these species are considered a valuable part of Victorian heritage. Salmonids were initially introduced to the cooler areas of the state (outside of the Murray River Basin) that generally had a poor selection of indigenous fish of interest to the angler or consumer (Clements, 1988).
The breeding of salmonids for stocking has been undertaken by private organisations and the State Government since their introduction and continues to this day. Between April and October each year, The Victorian Fisheries Authority releases between 300,000 and 400,000 salmonids into Victoria's public waterways. The commercial salmonid aquaculture industry in Victoria developed during the 1970s and 1980s and grows fish for human consumption as well as providing juveniles and advanced fish for restocking.
In 2003/2004, there were 29 operators holding a licence to culture salmonids with 22 farms currently producing stock (Anon, 2004). A confidential survey of the 22 operating farms was carried out in 2003 as part of the BPEMG and the results are summarised below. The results of a similar study carried out in 1998 are included for comparison.
Size, location and distribution
The Victorian salmonid industry produces five species: rainbow trout (Oncorhynchus mykiss); brown trout (Salmo trutta); chinook salmon (O. tshawytscha); brook trout (Salvelinus fontinalis); and Atlantic salmon (Salmo salar). Brown trout and chinook salmon are produced predominantly for re-stocking, whilst Atlantic salmon are grown to produce high quality caviar and flesh. Rainbow trout are the main species grown for human consumption (and are produced for re-stocking) and comprise over 95 percent of Victorian salmonid production. About 70 percent of farms are producing table sized fish (live, freshly gutted, filleted or smoked) but most also have other income streams from the sale of fertilised eggs, juveniles, value-added products (caviar, smoked fish, patè) or tourism (including fish-outs). Four farms have closed since the previous survey in 1998 and two farms have re-opened.
Figure 1 shows that production from the Victorian aquaculture industry is relatively stable on an annual basis with 1,500 to 2,000 tonnes of table sized fish produced each year. Production tends to decrease during periods of drought as farms lower stocking levels to cope with reduced water supplies and high water temperatures.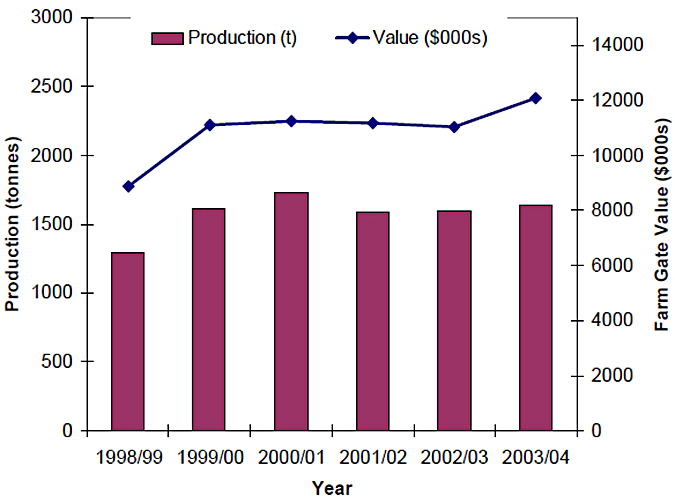
Figure 1: Production and value of salmonid aquaculture Ain Victoria during 1998 to 2003
Of the 22 farms producing table-sized salmonids, six (27 percent) are producing over 100 tonne per year, six (27 percent) are producing between 20 to 99 tonnes. Ten farms (45 percent) are producing less than 6 tonnes per year, with some fish-outs producing less than 1 tonne. In 2003, 42 percent of farms surveyed indicated that they had increased production over the last five years. The gains in production occurred mainly from the larger farms. Generally production at the smaller farms, and those involved in tourism (e.g. fish-outs), had remained relatively static, while a smaller percentage had decreased production over the last five-year period.
Twelve farms representing 85 percent of total production in tonnes in 2003 are located on tributaries of the upper Goulburn River system. The remaining farms are located within the upper catchments of the upper Murray River and Mitta Mitta River, Ovens River, Loddon River, La Trobe River and the Yarra River. Seventeen farms are situated on river drainages which flow into the Murray River system north of the Great Dividing Range. The remaining farms are located on coastal drainage systems south of the Great Dividing Range (Figure 2).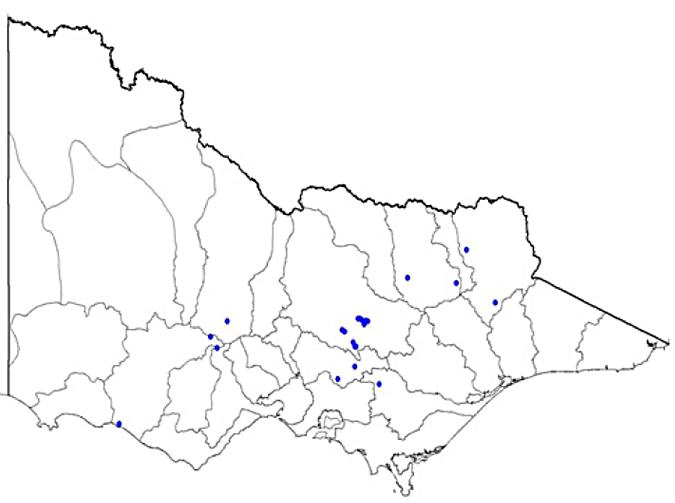
Figure 2: Location of Victorian salmonid farms in 2003
Farming systems
Freshwater salmonid farming requires a continual supply of relatively clean, cool water which is usually abstracted from an adjacent waterway, passed through the aquaculture complex and discharged back into the waterway downstream.
A schematic representation of general system components and the principal inputs and outputs of the farm is shown in Figure 3.
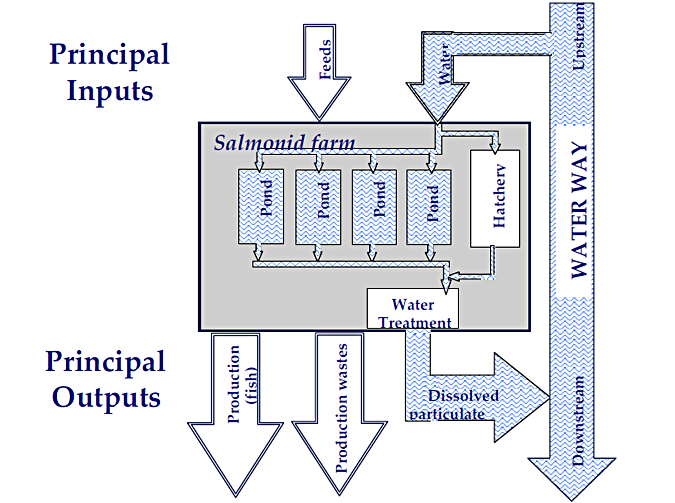
Figure 3: Schematic of a flow- through salmonid farm
Infrastructure components on Victorian salmonid farms commonly include:
- a hatchery;
- production units (e.g. ponds and raceways);
- a wastewater treatment system; and
- a processing facility.
Hatchery
The farming cycle for salmonids begins with the stripping and fertilisation of eggs from farm- reared broodstock during the winter months. The fertilised eggs are transferred first to incubators and then troughs or trays in a hatchery, where they are held in a plentiful supply of well- oxygenated water within an acceptable temperature range.
Once the eggs hatch and the yolk sac is absorbed, the juveniles are weaned onto artificial diets and held in troughs, tanks or specialised small ponds until they weigh about 5 g and are ready to be stocked into production units.
Production units
Two main production units are used for holding and growing fish in the Victorian salmonid industry:
Ponds: Ponds are the most common production units used on Victorian farms and are typically rectangular in shape and of earthen construction. with inlets and outlets positioned at opposite ends. Ponds are generally about 200 to 300 m2 in surface area and have a depth of 1.0 to 1.5 m. They are arranged in series or in parallel with water flowing from one to another by gravity before being discharged.
Raceways: A few farms use concrete raceways, narrow, rectangular structures, where water enters and leaves from opposite ends. With a high rate of water movement, optimal water quality parameters can be maintained allowing fish to be stocked at higher densities than earthen ponds (Masser and Lazur, 1997).
Water treatment system
About 70 percent of farms treat water before discharging it into the waterway from which it was extracted. Farms that do not employ water treatment are generally small production facilities and fish-out operations. A few larger farms are not required to treat wastewater in order to meet their licence conditions.
Wastewater treatment generally involves passing water through a settlement pond or, in a few cases, through a constructed wetland area before discharge. Settlement ponds allow particles to settle out of the water column by reducing horizontal water flow rates. Settlement basin design must consider volume of water to be treated, water velocity and the nature of the particles.
Processing facilities
Sixty- eight percent of farms undertake some processing of fish and had on-site processing facilities. The level of processing varies between farms and includes gutting, gilling and filleting. Some farms conduct further value adding through smoking, producing pates and caviar.
Principal inputs to salmonid culture systems
Fish
About one- half of salmonid farms do not have broodstock and hatchery facilities and must purchase juvenile fish or eggs from other farms. Stocking densities of 10 to 40 kg/m3 are common in intensive farms but less intensive farms stock at far lower densities.
In intensive systems, fish stocks are usually managed for year-round production and the onfarm standing crop (resident stock) represents about 33 to 50 percent of the annual production. Biomass on a farm may vary by as much as 50 percent over the year.
Water
Under intensive conditions, salmonids require continuous water exchange as they have a high oxygen requirement compared with other fish species and are more sensitive to poor water quality (Shepherd and Bromage, 1988). Demand for water (and dissolved oxygen) increases with higher water temperature and is inversely proportional to fish size. The Victorian salmonid industry diverted between 390 to 630 ML/day in 2003; an average of 0.35 ML/day is required to produce one tonne of product per year (range 0.2 to 0.8 ML/day). This ratio, where annual production in tonnes is approximately three times the daily water inflow in megalitres, is a .rule of thumb. adopted by traditional salmonid farms to estimate carrying capacity.
Adopting new technologies can allow farmers to increase production while using the same volume of water. For example, water requirements of salmonids can be lowered by artificially raising dissolved oxygen levels in the inflowing water and by water re-use. To increase oxygen levels, many farms employ passive aerators (e.g. waterfalls located between raceways or ponds) and or mechanical aerators such as paddlewheels and diffusers. Two Victorian salmonid farms use oxygen injection systems to increase the carrying capacity of their production systems especially during warm weather.
The majority of farms (90 percent) partially re-use the water diverted through their facilities. This may involve passing water through more than one pond or pumping a proportion of the effluent water back through the pond system (usually without any form of water conditioning before reuse).
Salmonids have a limited range of ideal environmental conditions. Optimal performance is highly sensitive to water quality including toxins such as dissolved metals present in water. Guidelines on the quality of water required for aquaculture production are detailed in Appendix 1.
Feeds and feeding
Feed costs can represent over 40 percent of total production costs on fish farms and feed is the major component of nutrient wastes from aquaculture. It is important that fish are fed the appropriate diet efficiently to minimise environmental impacts and ensure economic viability. The fundamental measure of feeding efficiency is the Food Conversion Ratio (FCR)1.
Hand feeding several times a day is the feeding technique used by the majority of salmonid farms with a limited amount of mechanised or automated feeding systems also in use. The importance of feed management to Best Practice Environmental Management (BPEM) in salmonid farming is considered in detail later in this report.
Historically, salmonid feeds were trash fish and raw offal products. Early manufactured diets were steam-pressed pellets produced by livestock feed manufacturers. These diets were characterised by low energy levels (8 to 12 percent) with high levels of indigestible carbohydrates used to aid pellet binding.
These low energy diets were dusty, had low water stability and generally resulted in much higher FCR than today.s diets. The steam-pressed ration used by the Victorian trout industry in 1998 had an industry-wide FCR of 2.05:1 (Ingram, 1999).
1 FCR = weight of dry food fed to fish : wet weight gain of fish flesh
Advances in technology and the understanding of salmonid physiology have led to the development of high-energy extruded feeds that are more stable, less dusty, highly digestible and have a much higher energy level (due to a higher level of oils). Commercially available high-energy extruded diets have protein levels of about 40 to 45 percent and energy levels of 22 to 28 percent. Whole-farm FCR range between 1.0:1 and 1.3:1.
Two companies are the main suppliers of salmonid diets to the Victorian industry and in recent years both have worked with industry to refine the quality and composition of their products. This has resulted in marked improvements to the efficiency with which diets are fed and the quality of the diets available.
A major difference between the 1998 and 2003 is the drop in the number of farmers sieving feed prior to feeding to remove excess dust or fines. In 1998, 33 percent of farms sieved feed compared with 25 percent in 2003 illustrating the increased use of extruded diets by industry.
An important element of managing nutrient discharge is using diets with appropriately low levels of phosphorus (P). Phosphorous is a mineral that is essential for normal growth and metabolism in salmonids. The main source of P is the diet. Although the P requirement for salmonids ranges from 0.5 to 0.8 percent (NRC, 1993), it has historically been incorporated to excess in diets. Compared with standard diets containing P levels of 1.7 percent, diets with P levels as low as one percent are commercially available.
Chemicals and therapeutants
Chemicals may be used in fish farming for a number of purposes (Table 1), including:
DisinfectantsDisinfectants may be used to clean and washdown equipment as well as sanitise footwear. The use of disinfectants is an important component of best practice management in aquaculture as they reduce the risk of disease or pathogen transfer. Disinfectants commonly used are chlorine-based (e.g. Chlorofoam) or sodium hydroxide.
TherapeutantsUnder the Chemical and Veterinary Chemicals Code Act, 1994 all agricultural and veterinary chemicals (as defined by the Act) must be registered by the Australian Pesticides and Veterinary Medicines Authority (APVMA) before they can be supplied, sold or used in Australia.
Chemicals used for therapeutic purposes in aquaculture include topical treatments applied externally and enteral treatments incorporated into diets. Topical treatments are infrequently used in salmonid aquaculture and their use is confined to hatchery production. It is usually prohibitively expensive to use this type of treatment in open ponds.
The most commonly used topical treatments are formalin and salt. When these chemicals are used in hatchery troughs, water flow is halted (and supplementary aeration applied) and sufficient stock chemical to attain concentrations of 30-100 ml/100 litre of formalin and up to 5 g/l of salt are applied. When the treatment is complete, freshwater flow is re-established and the treatment flushed from the treated tank.
Malachite green is a topical treatment that was commonly applied in aquaculture but is now prohibited.
Although common overseas, the use of antibiotics in salmonid aquaculture in Victoria is extremely rare. There are two recorded cases of antibiotic use in salmonid aquaculture in Victoria in the past 15 years. If they were used, it would be only in response to a catastrophic disease outbreak and must be administered under the supervision of a veterinary surgeon.
Feed additives Chemicals added to feeds include vitamins, minerals and pigments to ensure optimal growth, resistance to disease and product acceptance. Bioactive compounds such as antibiotics, hormones and certain minerals are not added to salmonid aquaculture diets except for specific applications (see Hormones below). Astaxanthin, a synthetic version of a naturally occurring carotenoid, is included in diets during the 12 weeks leading harvest to impart a pink colour to the animal.s flesh. Levels of pigment incorporated into diets ranges from 50 to 100 mg/kg.
Anaesthetics Anaesthetics are used to sedate fish prior to handling or harvest. Several fish anaesthetics are commonly available but only one is currently approved by the APVMA for use in aquaculture. MS 222, an aquaculture sedative commonly used in the North America, is not approved for use in aquaculture.
Hormones Hormones are used in hatcheries for manipulating the sex of stock or to induce spawning. Not all hatcheries use hormones.
Female salmonids have higher growth rates and are bigger than males (Piferrer, 2001) which tend to mature early and stop growing. The males continue to feed, increasing the farm.s FCR and lowering the quality of its product.
Methyl-testosterone has historically been used to masculinise swim-up fry so that, when they breed the next season, their progeny are all female. Only a small number of fry are treated in this manner (at a rate of 3 mg/kg in feed). The annual industry usage of this drug is unlikely to exceed 50 mg. The chemical is used under a permit from the APVMA and processes for re-registering the use in the salmonid industry are underway. Farmers need to have a permit under the Drugs, Poisons and Controlled Substances Act, 1981 to access the chemical and fish destined for human consumption are not treated with this hormone.
Ovaprim is a synthetic hormone that mimics the effects of the hormones that regulate the reproductive cycle in fish. It is used to induce spawning in broodstock.
Fuels Fuels such as diesel and petrol are used on salmonid farms for machinery and generators.
Table 1: Chemicals used in the Victorian salmonid industry
| Use | Chemical | Comments |
|---|---|---|
Disinfectants Sodium hydroxide | Chlorine-based Hydrogen peroxide |
|
|
Therapeutic Chemicals | Salt (sodium chloride) Formalin Antibiotics |
|
| Feed Additives | Pigments Vitamins and minerals Bioactive compounds |
|
| Anaesthetics | Isoeugenol |
|
| Hormones | Methyl-testosterone Ovaprim |
|
| Fuels | Diesel LPG |
|
Principal wastes from salmonid culture
Many environmental impacts of inland salmonid culture are associated with wastes generated during fish production. This section summarises the main wastes generated and the characteristics of these waste streams. Wastes can be defined as materials used during fish farming that are not removed during harvesting. In the case of salmonid aquaculture, wastes can be divided into the following categories:
- organic matter, mainly uneaten feed and fish excreta, in effluent;
- sludge from settlement ponds;
- chemicals and therapeutants;
- fish mortalities and processing wastes;
- fish escapes; and
- greenhouse gas emissions.
Effluent characteristics
Effluent from freshwater fish farms has solid and soluble fractions. Solid wastes are comprise mainly uneaten fish feed and faeces but can include solids suspended during cleaning of ponds or sediment basins. Soluble components are nitrogen (N) in the form of ammonia and urea produced by fish metabolism and excreted. Effluent quality and quantity is a product of several factors including:
- the quality and composition of feed administered and the efficiency with which it is fed (Food Conversion Ratio) and assimilated by the fish;
- water exchange rates in the system; and
- the degree of recycling and water treatment prior to discharge.
Due to different system efficiencies and feeding strategies, effluent can vary substantially in composition and magnitude between different sites. During 1988/1989, the EPA conducted a study to quantify effluent loads from three Victorian salmonid farms (Metzeling et al., 1993). The results are summarised in Table 2.
No recent studies on effluent quality can be used for direct comparison with the results of the 1988/1989 study. Industry monitoring has been conducted regularly since that study to comply with their EPA licence, but that data was not readily available for presentation in this report.
Substantial improvements in effluent quality are expected based on improved management practices. Numerous overseas studies have clearly demonstrated the link between improved management practices, particularly feed management, and improvements in effluent quality (Ackefors and Enell, 1994; Kelly et al., 1996; Axler et al., 1997). Improvements in effluent quality can also be quantified using the mass balance approach, which shows the impact on wastes discharged by reducing feed inputs and using better quality diets.
Following is a discussion of the principal components of aquaculture effluent.
Suspended solid loads Suspended solid loads from flow-through aquaculture systems are composed mainly of uneaten feed and fish faeces. A proportion of the feed remains uneaten in intensive systems and 25 to 30 percent of consumed food is egested as faeces (Beveridge et al., 1991). Solid loadings will also vary considerably depending upon the season, time of day, feeding rates, fish sizes and management practices such as pond or settlement pond cleaning.
Table 2: Loading rates (kg/day) of some water quality parameters from three Victorian fish farms during 1988/1989 (adapted from Metzeling et al. 1993)
| Source | Suspended Solids | Total Nitrogen | Total Phosphorous | Biochemical Oxygen Demand (5 day) |
|---|---|---|---|---|
| Farm 1 | 48-102 | 13-17 | 2.5-2.7 | 48-5A |
| Farm 2 | 4-28 | 4-8 | 0.9-1.8 | 34-36 |
| Farm 3 | 1100-1000 | 67-80 | 16.3--32.0 | 267-333 |
Nutrients Fish utilise N (as protein) and P for growth, as an energy source and for metabolic functions. Nitrogen and P are introduced to the system primarily as fish feeds that will either be eaten or wasted, depending on the efficiency with which the feed is delivered. Nutrients are also lost to the environment as faeces and other excreta. If feed management is poor, feed will be wasted, FCR will be high and higher nutrient loads will result. As with suspended solids, the type and amount of N and P released will vary daily and seasonally.
Organic matterEffluent contains biodegradable organic matter that can exert a biochemical or chemical oxygen demand (BOD or COD) on the receiving environment. Much of the biodegradable organic matter that produces the BOD and reduces dissolved oxygen (DO) concentration is present in the particulate fraction. Dissolved oxygen concentrations are also reduced through fish respiration and the combined effect results in a reduction in DO level as water passes through the fish farm.
Toxic metabolites
Some constituents of fish farm effluent can, under some circumstances, be directly toxic to fish and other biota. These include ammonia, nitrite and carbon dioxide.
Sludge from settlement ponds
Settlement and production ponds require regular cleaning to remove built-up sludge and to avoid the leaching of nutrients to the overlying water. This is achieved by draining the pond and physically removing sludge by shovel, backhoe or excavator. A continuous self-cleaning system such as a submersible sludge pump that moves across the base of the pond can also be used. In 2003, the majority of farmers indicated that settlement ponds were cleaned yearly. Current sludge disposal options include land application as a fertiliser, composting, on-site disposal in a pit, and landfill disposal.
The removal and concentration of suspended solids from production and settlement ponds results in a sludge that should be managed carefully and according to the waste management hierarchy (Environment Protection Act, 1970, section 1 (1I and 1J) reprint 14, July 2002 or later; EPA, 1990). Disturbing these settled solids can increase the solid loads discharged from the farm. Studies have reported that at an FCR of 1.2:1, one litre of sludge is produced for each kilogram of feed supplied (Bergheim et al., 1993).
Chemicals and therapeutants
Categories of chemicals that may be used on salmonid farms were outlined in Table 1. The quantity and type of chemicals that will enter the waste streams of a salmonid farm will depend on the mode of application. Chemicals most likely discharged as wastes are those administered directly to water (e.g. salt and formalin) and those contained in feeds (e.g pigments, vitamins and mineral and hormones).
The quantities of chemicals used are very low and will be diluted by water from the rest of the farm prior to discharge to the environment. Chemicals may also enter the waste stream through accidents or spills.
Fish mortalities and processing wastes
Fish mortalities occur during production, and regardless of the reasons for the mortality, require prompt removal from culture units and careful, effective management. Although routine fish mortalities are buried on-site at most large farms some facilities compost these wastes for use as pasture fertiliser.
Processing wastes are generated when fish are gilled and gutted on-site prior to transfer to market. The main wastes produced by fish processing operations are blood, viscera, heads and frames (i.e. offal). The survey indicated that around 235 tonnes of processing wastes are generated by the industry every year. The majority of farms bury this offal in pits on-site but an increasing number are composting with other primary products. Liquid wastes from fish processing are generally discharged to septic or sewer systems.
It should be noted that fish mortalities and processing wastes are prescribed wastes and can be disposed only to landfills licensed to accept this waste. The movement of these wastes is a scheduled activity and can be undertaken only with appropriate transport permits.
Fish escapes
Ponds are a relatively secure aquaculture production system; however, fish can escape through ill-fitting or poorly maintained screens or during handling or transport. Fish escapes can have a severe economic impact on salmonid farmers and it is in the farm.s interests to limit this loss. For this reason, large-scale escapes of fish from salmonid farms are uncommon. There are no data available on the number of fish that escape from Victorian salmonid farms each year.
Greenhouse gas emissions
The primary source of greenhouse gas emissions from salmonid farms is respiration of stocked fish. Fish excrete 1.4 grams of carbon dioxide (CO2) for every 1 gram of oxygen they consume (Summerfelt, 2002). Salmonids produce 0.3 to 0.4 grams of carbon dioxide for every 1 gram of feed consumed. Other sources of greenhouse gases include the fossil fuels burned to produce electricity for lighting, refrigeration, heating and cooling, petrol, diesel and LPG for transport and running generators and wood for smoking.
Regulation and legislation
This section summarises the statutory requirements of salmonid farming in Victoria as well as other non-legislative policies and strategies. Legislation of salmonid aquaculture falls into four general categories:
- planning legislation;
- water diversion legislation;
- fisheries legislation; and
- environmental legislation.
The process by which proponents apply for authorisation to conduct salmonid and other forms aquaculture on private land is summarised in Figure 4.
Planning guidelines have been issued to assist investors through the approval process (DPI, 2005).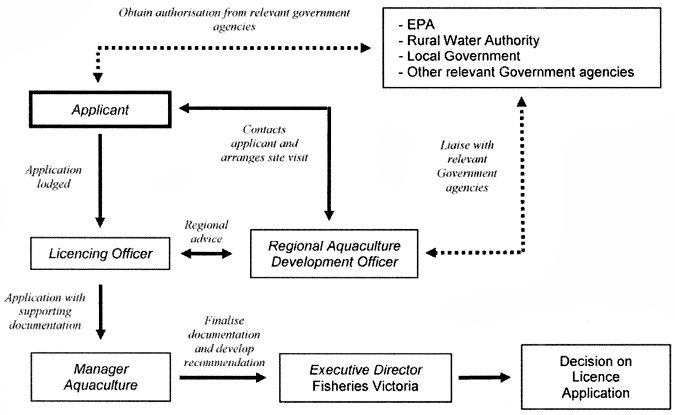
Figure 4: The Victorian Fisheries Authority aquaculture licence application process
Planning legislation
For new farms, planning permission is required from the relevant local authority for the use and development of freehold land. The local authority also functions as the coordinating agency for referral agencies.
The Planning and Environment Act 1987 empowers planning authorities to make planning schemes over any land in Victoria including land that is covered by water (ORR, 1999). The Victorian Planning Provisions (VPP) is the reference document from which planning schemes are sourced and constructed.
Aquaculture is a discretionary use in all VPP zones (DPI, 2005). The only exception may be Public Conservation and Resource Zones where a permit is not required subject to specified conditions; otherwise the use of these zones for aquaculture is prohibited. It is likely that only VPP Rural Zones may be appropriate for salmonid aquaculture although consideration would need to be given primarily to the visual appearance of any buildings.
Often the main purpose of the zone is to provide for the sustainable use of the land for extensive animal husbandry and crop raising. Although no specific mention is made of aquaculture, the use is nested within agriculture, and one could reasonably assume that these are the most appropriate zones for agricultural activities.
Water diversion legislation
Salmonid farming is classed as a non-consumptive user of water (i.e. the amount of water diverted is equal to the amount discharged back to the waterway) and a water diversion licence from a Rural Water Authority (RWA) is required under the Water Act 1989. A water diversion licence provides conditions for the extraction and utilisation of water from a waterway or bore and provides specifications for alterations to a riverine environment required for the purpose of extracting that water. It authorises licence holders to divert and use a specified amount of water in megalitres (ML) from a specified waterway for aquaculture purposes. It stipulates the maximum rate of diversion (ML/day), maximum daily volume, total annual volume and land on which the water is to be used.
When processing licence applications, a RWA considers several factors including:
- existing and projected availability of water and water quality in the area;
- adverse effects on the riverine and riparian environment;
- the drainage regime and existing water use;
- the amount of water to which the applicant is already entitled;
- the volume of water allocated for sale;
- the need to protect the environment;
- government policies about the preferred allocation or use of water resources;
- the Heritage Rivers Act 1992;
- the proper management of the waterway and its surrounds; and
- how the water is to be used and needs of other potential applicants.
There is no guarantee of water quality and the licensee is required to comply with the conditions of the licence. The applicant may need to provide information on:
- daily flow rate requirements;
- low flow frequency in the waterway and flooding characteristics of the area;
- type of proposed diversion works and outfall works, including engineering drawings;
- flow monitoring proposals;
- operating arrangements;
- distances between diversion and discharge; and
- existing water quality and water quality impacts of the proposal.
Authorisation to undertake works on waterways
A waterways work permit is required from the relevant Catchment Management Authority (CMA) before any work is undertaken on waterway. This requirement applies to works within the bed and on the banks of waterways. The permit is issued under the CMA.s waterway protection by-law (made under the Water Act 1989).
Fisheries legislation
Under the Fisheries Act 1995 (the Act), an aquaculture licence is required from The Victorian Fisheries Authority to operate a fish farm in Victoria on both private and Crown land. An aquaculture licence is annually renewable and authorises the holder to use, form or create habitats on private land for commercial aquaculture purposes and to hatch, grow and hold permitted fish for commercial aquaculture purposes.
Entitlements and conditions of an Aquaculture (Private Land) Licence are provided in the Fisheries Regulations 1998. The Act also provides for the protection of both recreational and commercial fisheries, protected aquatic biota, including those listed under the Flora and Fauna Guarantee Act 1988, and protection against the introduction and spread of declared noxious or prohibited aquatic species and notifiable diseases.
A General Permit - Aquaculture Research can also be issued for a variety of purposes such as aquaculture project development and economic research. Permits are issued for up to three years. An aquaculture permit is an annual, renewable, fee-based authorisation which is described in more detail in the Fisheries Regulations 1998.
Environmental legislation
The Environment Protection Act 1970 and its subordinate legislation, State Environment Protection Policies (SEPP), are designed to protect beneficial uses downstream of any discharge or activity (licensed or otherwise). The EPA is responsible for preparing and recommending SEPP to government and it is the responsibility of all government agencies, industries and communities to implement SEPP requirements. The SEPP (Waters of Victoria) and its schedules identify beneficial uses (Table 3) for particular segments of the environment (Figure 5) and establish ambient water quality objectives (Appendix 2) (Victorian Government Gazette, 2003).
To protect beneficial uses, the discharge of wastewater to surface waters must be managed to minimise environmental risks. The EPA is responsible for implementing the SEPP (Waters of Victoria) and intends to do this with the salmonid aquaculture industry through:
- revising existing licences to ensure they are consistent with the policies;
- requiring licence holders to assess options for implementing the waste hierarchy and develop improvement plans to implement the preferred options and to reduce impacts of discharges on beneficial uses; and
- approving a mixing zone as part of a discharge licence where a discharge cannot practicably be avoided, re-used and recycled and where wastewater management practices are not effective.
Proponents of new and expanding salmonid farms must ensure their farming activities do not compromise beneficial uses reliant on the quality of water, particularly those posed by inputs of nutrients, pathogens and aquatic pests. Most salmonid farms are located in the highlands and forestry zones and rely on a high quality water resource. The beneficial uses of these zones must be preserved to ensure the sustainability of the industry. The impact of discharge from salmonid farms on nutrient concentrations in receiving waters should be determined at a range of environmental flows (especially base flows) specific to the site or catchment, to ensure the environmental quality objectives are not exceeded.
Fish farms with a design flow rate of 0.2 ML/day or more are designated as Scheduled Premises under the Environment Protection (Scheduled Premises and Exemptions) Regulations 1996 and are subject to the works approval and discharge licensing provisions of the Environment Protection Act 1970. Only fish farms discharging or depositing waste solely to land are exempt from licensing.
The licence review to be undertaken by the EPA will develop licence conditions for discharges using environmental quality objectives and a risk assessment based on an understanding of the health of receiving waters. Compliance with licence conditions will ensure the impacts of discharges are minimised to protect the beneficial uses of receiving waters. Appropriate monitoring is needed to demonstrate compliance and monitoring requirements will be outlined in the licence.
As part of an up-to-date EPA discharge licence, the licensee will be required to:
- monitor water flow and quality through the farm as well as other waste streams, their volume and management;
- provide a plan for environmental improvement;
- undertake annual reviews of the operation and submit an annual report, including progress towards environmental objectives; and
- notify the EPA of all major events that may impact on the quality of wastewater leaving the property or the overall operation of the farm.
If a mixing zone is required for an existing or new operation, it must be approved by the EPA and will constitute part of an overall discharge licence. The geographic extent of this zone and the water quality objectives to be achieved need to be determined by the licence holder.
Information required to determine acceptable minimum dilution factors within receiving waters includes:
- average monthly and daily flow distribution within the waterway;
- minimum mean daily flow distribution within the waterway;
- nutrient concentrations in discharge water; and
- minimum, monthly and average effluent dilution calculations.
Animal effluent and residues including fish processing wastes are classified as prescribed wastes (Schedule 1, Environment Protection (Prescribed Waste) Regulations 1998), and requires conditions detailed in regulations to be adhered to when transporting and depositing waste off-site.
Table 3: Beneficial uses to be protected (Victorian Government Gazette, 2003)View Table 3
F6: refer to beneficial uses set in SEPP (Waters of Victoria) - Schedule F6. Waters of Port Phillip Bay
F8: refer to beneficial uses set in SEPP (Waters of Victoria) - Schedule F8. Waters of Western Port and Catchment
F3: refer to beneficial uses set in SEPP (Waters of Victoria) - Schedule F3. Gippsland and Catchment
nb. Schedules F8 and F3 include marine and estuarine segments as well as rivers and streams within the catchments. Schedules F7 (Waters of the Yarra Catchment) and F5 (Waters of the Latrobe and Thomson Rivers and catchment) include beneficial uses for the relevant waterways.
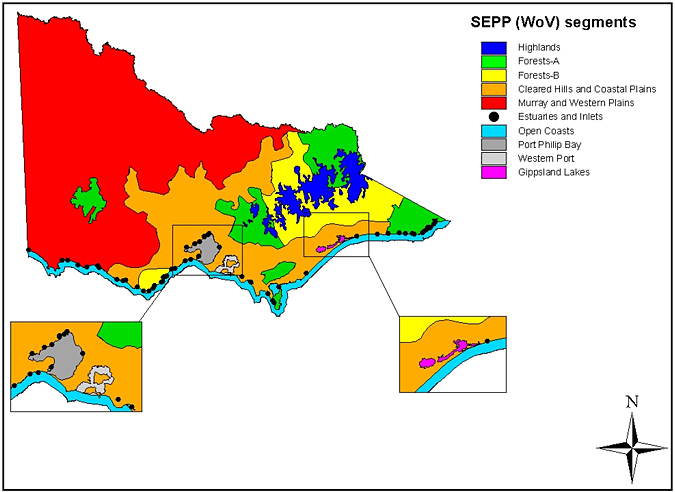
Figure 5: SEPP (Waters of Victoria) and its schedules environment segments (Victorian Government Gazette, 2003)
Identifying and evaluating environmental issues
The aquaculture industry has a complex interaction with the environment on which it relies to provide a suitable culture medium for stocked fish and to dilute and disperse culture wastes. It is in the interests of aquaculture companies to ensure a clean, safe environment in and around their farms (Cripps, 1994).
This section identifies the environmental issues associated with salmonid aquaculture, and evaluates and prioritises these issues for industry. The issues identified as significant may be more or less important to an individual farm. Many of the impacts detailed here will be site specific, depending upon the location, size and management of the farm. The industry-level assessment was more complex than single site assessments as it encompassed a wider range of potential impacts. The ranking system prioritises environmental issues that the industry should address in order of importance and is not an assessment or ranking of actual impacts on the environment from salmonid aquaculture.
Environmental issues were evaluated and prioritised for the salmonid sector using a standard assessment process. The results were debated at a workshop with representatives of the salmonid aquaculture industry and relevant government agencies held at PIRVic, Snobs Creek on 28 May 2004.
Impacts of salmonid aquaculture on the environment
The environmental considerations which should be examined when developing and operating a fish farm include (after Gavine et al., 1996):
- impacts on the aquatic ecosystems including beneficial uses as specified in the SEPP (Waters of Victoria) and its schedules (Victorian Government Gazette, 2003);
- impacts on indigenous flora and fauna;
- impacts on humans in terms of nuisance or health risks; and
- impacts on the wider global environment.
Impacts on aquatic ecosystems
SEPP water quality objectives must be used as a benchmark for water quality, as they are the statutory requirement to ensure the protection of beneficial uses within that segment. As discussed in Section 3, the SEPP (Waters of Victoria) and its schedules require that aquaculture activities do not negatively impact on the stated beneficial uses of the fish farm segment. In practice this means downstream water quality should not deteriorate as a result of wastes to the extent that it has a detrimental impact on aquatic ecosystems or is rendered unsuitable for other users. Compliance with licence conditions will ensure that the impacts of discharges are minimised.
Potential impacts of aquaculture on aquatic ecosystems include:
- impacts of effluent discharge on the quality of surface waters;
- impacts of water abstraction on water sources; and
- impacts of other waste sources (e.g. mortalities and processing wastes) on surface waters.
Issues associated with each of the above were assessed individually. The results are summarised in Table 4 and explained in detail on the next page.
| Category | Specific Issue | Best Management Practices |
|---|---|---|
| Impacts of effluent discharge (catchment) |
|
|
| Impacts of effluent discharge (local) |
|
|
|
| |
|
| |
| Impacts of water abstraction |
|
|
| Impacts of mortalities and processing wastes |
|
|
Table 4: Issues related to impacts on the aquatic environment
Impacts of effluent discharge on the quality of surface waters
Aquaculture effluent can contain solid and soluble wastes with the potential to negatively impact on receiving water quality. The main issues include (Table 4):
- Nutrient enrichmentThe addition of nutrients to the receiving watercourse is one of the most ecologically significant impacts of fish farming (NCC, 1990). Nutrients (particularly P) in salmonid effluent are biologically available and may contribute to other sources of nutrients in the catchment (e.g. agriculture, sewage, and virgin bushland) and stimulate primary productivity (e.g. algal blooms) downstream in the catchment. Algal blooms can impact on downstream beneficial uses, particularly agriculture industries, recreation and tourism and domestic water supplies.
- Increased water turbidity and sedimentationSolid wastes discharged from fish farms are generally denser than water and, if current velocities are low, may settle out and accumulate downstream of the point of discharge. De-silting of ponds and settlement ponds can lead to additional solid loads in the effluent stream.
- Reduced dissolved oxygen levelsDissolved oxygen in effluent waters can be reduced through consumption of oxygen by the stocked fish and during bacterial breakdown of wastes. If the effluent is low in oxygen and or has a high oxygen demand, deoxygenation of the receiving waters can result in localised deterioration in water quality.
- Direct toxicitySome chemical constituents in the effluent (e.g. ammonia, nitrite, chemicals and therapeutants) can occur in forms or at levels that are toxic to resident biota. For example, ammonia toxicity increases with increasing pH and temperature, as the unionized fraction becomes dominant. Risks from direct toxicity can increase during periods of low flow periods and warmer weather.
- Catchment scale issuesFish farms that discharge to surface waters contribute to the total nutrient load of the catchment and as such increase the likelihood of algal blooms and other related downstream impacts. The importance of their contribution will be catchment-specific depending on the number and size of farms that discharge, nutrient loads from other sources and the sensitivity of the catchment to nutrient inputs.
In areas where nutrients are of particular concern (e.g. Goulburn-Broken catchment where 16 of the 22 operating farms are located) the industry has made considerable efforts to reduce nutrient levels in effluent. Based on estimates for the 1993/1994 season, total P load from aquaculture facilities was, in 1998, limited to 28.6 tonnes (GBWQWG, 1995). Since 1993, the level of P discharged from trout farms has fallen from 28.3 tonnes to about 19 tonnes (equivalent to 12.9 kg/tonne of fish) in 1999/2000 (Figure 6). This is despite production increasing from 1,180 to1,403 tonnes during the same period (Ingram, 1999).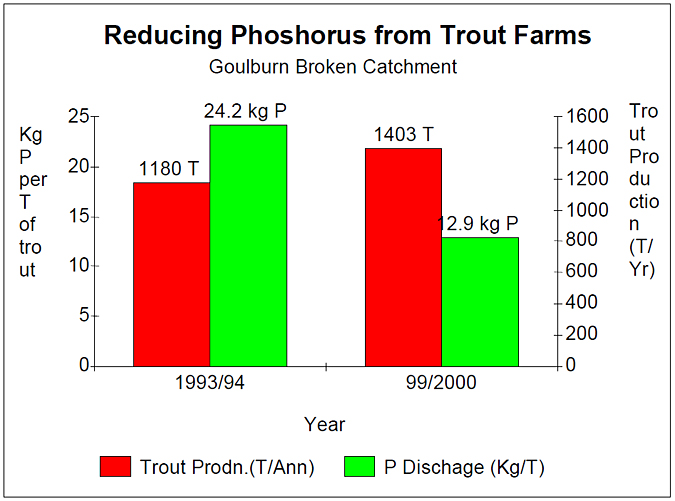
Figure 6: Phosphorous loads from fish farms in the Goulburn-Broken catchment in 1993/1994 and 1999/2000
- Local issuesLocalised impacts of fish farm effluent on water quality will be site specific and depend upon the quality and quantity of effluent and the capacity of the receiving watercourse to dilute and disperse the wastes.
Studies were conducted on the effects of fish farm effluent on water quality in upland Victorian watercourses in the late 1980.s and 1990.s (Metzeling et al., 1993; Metzeling et al., 1996; Metzeling, 1999). Although the studies showed that effluent quality is generally good compared with other industry discharges, nutrient levels in fish farm effluent are high compared with levels in receiving streams. The location of farms in high quality environments means adverse impacts occur especially during low flow conditions in the receiving watercourse. The large volumes discharged from salmonid farms are difficult to treat and nutrient enrichment impacts (e.g. algal and macrophyte blooms) can be significant on a local scale.
Increased water turbidity and sedimentation can result from pond de-silting. Once removed from the pond, sludges may be settled or dried to reduce volume and concentrated solids can be disposed of in pits or used as a fertiliser. Pond desilting is generally infrequent and the consequences are likely to be minor to moderate and dependent and site- specific. There is no record of long-term or significant impacts of solid waste discharges of this nature from Victorian farms.
As DO must be maintained at high levels for fish culture so reduced DO levels in receiving waters should not occur during routine operations. Low DO can occur as a result of pond de-silting or when flows in receiving water are exceptionally low but, as low DO will be replenished by water flow, the consequences are likely to be transient.
Similarly, levels of metabolites (e.g. ammonia and nitrite) discharged in effluent should not be toxic to aquatic life. Elevated concentrations of metabolites can occur under certain circumstances (see above) but the consequences are likely to be transient.
The impact of chemicals and therapeutants on water quality in the receiving watercourse will depend on quantities used, toxicity of the compound to aquatic biota, the rate of breakdown in the environment and the dilution afforded by the farm water flow and receiving water. Chemicals most likely discharged in the waste stream are salt and formalin, which are used as therapeutics, and feed additives (e.g. pigments, vitamins and minerals). As salt and formalin are used in small quantities in hatcheries or infrequently to treat diseases, concentrations will be greatly diluted within the flow of the farm prior to discharge.
Impacts of water abstraction on surface water resources
The abstraction of water from rivers for fish farming can result in physical, chemical and biological changes in running-water habitats (NCC, 1990). Depletion of flow between the intake and outflow of farms may result in the following impacts (Table 4):
- changes in channel shape and patterns of sedimentation with consequences for siltation and subsequent water movement;
- loss of spawning or nursery areas for aquatic species;
- alteration to the biological communities of rivers through loss of dilution capacity between inflow and outflow, reduced turbulence and oxygenation; and
- backside intrusion from the need to install structures and channels into a river.
Although it does not cause the same level of concern as farms located on regulated rivers, water abstraction can be a major issue for farms located on unregulated rivers. Impacts related to water abstraction will vary widely between farms, with some farms located on unregulated rivers experiencing annual problems and others experiencing problems in extreme drought or other extraordinary conditions. The severity of impacts will also be site specific and depend upon the location of the farm, its water source and the severity of external impacts.
Similarly, the consequences of water abstraction on spawning and nursery areas and biological communities will be related to the severity and frequency of impacts as well as the ecological sensitivity of the receiving watercourse.
Key factors determining the scale of impact include the:
- Proportion of total flow abstractedDemand for water for salmonid farms is highest during the summer months when water temperatures are higher. For farms on regulated rivers, this period should coincide with the irrigation season when river flows are also high. For farms on unregulated rivers, problems may occur as peak water demand periods will coincide with low river flows.
- Distance between outfall and intakeFarms with large distances between intake and outfall on unregulated rivers may have a greater impact than other farms
- Impact of the inflow weir as a barrier for the passage of fish and other aquatic organisms
Impacts of mortalities and processing wastes on water resources
Mortalities and processing wastes are commonly disposed of by burial in pits located on-site. If these pits are not properly designed and maintained, contamination of local groundwater or surface waters can occur. Leachate from these pits will have a very high oxygen demand and contain high levels of substances such as ammonia and nitrite. The consequence of leachate reaching surface or groundwater, even though it is unlikely to occur, will result in moderate environmental harm. (Table 4).
As pits require EPAapproval before construction, the likelihood of impacts occurring is low.
Impacts on flora and fauna
Impacts on indigenous flora and fauna can occur during construction and operation of the aquaculture facility. Three main areas of concern identified with respect to indigenous flora and fauna are (Table 5):
- destruction or alteration of habitats during construction and operation;
- interactions with mammals and birds; and
- interactions with native fish populations.
Destruction or alteration of habitats during farm construction and operation
Habitats of indigenous flora and fauna can be destroyed during clearing of land, draining of wetlands for construction and earth moving. Clearing of native flora can significantly impact the biodiversity of local flora and fauna, particularly where threatened or endangered species are involved. Other issues may arise from the disturbance of riparian vegetation that can increase erosion rates and affect the hydrology of local rivers reducing water quality and smothering aquatic habitats.
Table 5: Potential impacts of salmonid farms on flora and fauna
| Category | Specific Issue | Best Management Practices |
|---|---|---|
| Destruction or alteration of habitats |
|
|
|
| |
|
| |
| Interactions with birds and mammals. |
|
|
|
| |
| Interactions with native fish |
|
|
|
| |
|
|
Impacts will be minor to moderate, as all activities require planning permission and EPA approval. As new farms are approved infrequently, the likelihood of this issue occurring is considered to be low.
Similarly, construction on established industry sites must receive permits from the local authorities and the EPA, so consequences should be minor to moderate. These events might take place where farms are re-designed or retrofitted to improve their environmental performance.
Alteration of habitats during the operation of salmonid farms relates to the ecological consequences of modifications in water and sediment quality described earlier and as such will occur with the same frequency. Specific issues include the smothering of aquatic benthic habitats by accumulated solids, water quality unsuitable for aquatic life and loss of habitats or spawning areas between intake and outfalls.
The consequences of this will be site specific, depending on:
- the quality and quantity of effluent discharged, the capacity of the river to dilute and disperse wastes and the ecological sensitivity of the river; and
- the distance between intake and outfall and the proportion of the flow diverted.
Interactions with birds and mammals
Fish-eating birds and mammals are attracted to aquaculture sites due to the availability of fish and feeds. They can cause problems for fish farmers as they harass and prey on stock, which can cause significant economic damage. Aquatic and terrestrial mammals (e.g. kangaroos and wombats) can interact with fish farms and potentially damage infrastructure as well as raise occupational health and safety (OH&S) issues (e.g. wombat holes). Farmers usually employ predator control measures (such as fencing, netting, scarers and guards) to restrict the entry of or scare off fisheating predators.
Assessment of issues related to birds and mammals
Although interactions with predatory birds are highly likely to occur, simple countermeasures that have low impact on those bird populations can be implemented. Terrestrial and aquatic mammals may encroach onto farms but environmental consequences will depend on the type of mammal, the extent to which it causes a problem and exclusion measures used.
Installing anti-bird netting over production units, using scare guns and removing any potential food sources (e.g. mortalities and processing wastes) can reduce the attractiveness of a site to birds and mammals.
Interactions with native fish populations.
Fish farming can affect native fish in the following ways (NCC, 1990):
- modification of habitat;
- the escape of non-native species that may prey upon or compete with native stocks limited resources and, in large numbers, can reduce genetic diversity within the community;
- disease transmission to native stocks; and
- impact of hormones or bioactive compounds on native fish breeding cycles.
As escaped fish are a financial loss to the farmer and cause impacts on the environment, salmonid farms are designed to hold fish securely within the farm. Ponds are built to prevent overflow in extreme weather and are securely screened to prevent fish from moving between and out of them.
A large-scale escape of salmonids will have an impact on native species but the likelihood of this occurring is relatively low. Breeding populations of rainbow trout and brown trout are present in the rivers where Victoria salmonid farms are located and a large number of salmonids are released each year by the Victorian Government and angling clubs in re-stocking programs. The consequences of escapes of salmonids on native fish populations are likely to be relatively minor.
The likelihood of disease transmission to wild stocks from intensive aquaculture is unlikely as scientific evidence suggests disease organisms present in farmed stocks are also present in wild stocks. Farmed fish are more susceptible to disease outbreaks as they are held under more intensive conditions and it appears that, when endemic, most pathogens in farmed stocks are acquired from wild fish (NCC, 1990). The consequences of exposure of wild fish to pathogens from aquaculture should not lead to widespread harm.
Concerns have been raised about the potential impacts of hormones or bioactive compounds on the breeding cycles of native fish. Bioactive compounds are not used in Victorian salmonid aquaculture. Hormones are used in extremely small quantities in hatcheries on a small number of fish. Ovaprim, a synthetic hormone used to initiate spawning in broodstock, is injected directly in minute quantities and only reaches the environment through excretion. Methyl- testosterone is incorporated into feeds at a concentration of 3 mg/kg and administered to swim-up fry over a period of 70 days (Shepherd and Bromage, 1988). Only that contained in waste feed or excreta reaches the effluent stream; total industry usage is unlikely to exceed 50 mg per year.
Feed pellets break up as they pass through the farm and a proportion will be removed in sedimentation ponds prior to discharge. Native fish will be affected by methyl-testosterone in feed only if they consume waste feed over a prolonged period. Given the extent of dilution that the feed will receive from the larger farm and the receiving watercourse, this is highly unlikely.
Impacts on humans in terms of nuisance or risks to health
Table 6 lists the issues that may impact on humans living or working at or in the vicinity of fish farms.
Visual impacts
These impacts relate to the visual intrusion of buildings, culture facilities (e.g. ponds and raceways) and the appearance of the site may have in agricultural landscapes.
Fish farms use buildings and equipment installations similar to those used in other forms of terrestrial farming, so their visual impact is low. Ponds are either very low profile or level with ground elevation and provide little visual intrusion. Inflow and outflow points may have continuously operating equipment and security lighting. Visual issues could arise from poor farm management through scattered equipment and litter. In general, the visual impacts of fish farms are not significant and most blend in well with the agricultural landscape.
Table 6: Potential impacts of salmonid farms on humans
| Category | Specific Issue | Best Management Practices |
|---|---|---|
| Visual Impacts |
|
|
| Noise |
|
|
| Odour |
|
|
Noise
Most fish farms regularly use machinery or undertake activities that cause some form of noise. As farms are situated in rural areas, these noises are commonplace and do not generally cause a nuisance.
Fish farm noise usually comes from continuously running mechanical equipment such as pumps and aerators. Intermittent noise can result from construction activities, use of heavy vehicles for transporting stock and feed, and equipment used to scare predatory birds. Interim guidelines giving acceptable noise levels at different times of the day are in place for control of noise from industry in rural areas (EPA, 1989).
Odours
Although all farms generate wastes that may cause odour problems, the majority handle wastes appropriately so odour problems are infrequent and the consequences transient.
Unpleasant odours from fish farms come from solid organic wastes, mortalities and the byproducts of processing. Disposal of processing waste products and fish mortalities on-site can also generate odour problems and raise other operational considerations.
Impacts on the wider global environment
Impacts on the wider global environment influence how the industry is perceived by the wider community.
Selection of fish diets
Fish food is a major input to aquaculture systems and its quality and the efficiency with which it is fed are important to effluent quality and production of sludge wastes. Agrowing issue for the aquaculture industry internationally is its apparent dependence on fishmeal-based diets.
Fishmeal is the product of wild-caught fish stocks, a number of which are classified as fully exploited, over-exploited or depleted (Naylor, 2000; FAO, 2002). Concerns that aquaculture is depleting wild fish stocks has captured the imagination of environmental groups and the media and is regularly cited as a negative impact of the aquaculture industry.
The finite availability of fishmeal is a major constraint to aquaculture development internationally. The amount of fishmeal used in aquafeeds increased from 10 percent in 1989 to 37 percent in 1997 (Tacon, 1993) but the overall production of fishmeal is static at approximately 6 million tonnes per year. The aquaculture industry and feed manufacturers have worked for more many years to identify alternatives to fishmeal as an ingredient in aquaculture feeds. In Australia, feed manufacturers replace fishmeal with vegetable raw materials at a rate of inclusion that grew from 5.5 percent to 11.4 percent between 2001 and 2002 (H. Klamer, Skretting Australia, pers. comm.).
Feed manufacturers apply a purchasing policy that requires fishmeal and fish oil to be sourced only from managed and sustainable fisheries. The aquaculture industry should continue to work with feed manufacturers to develop cost-effective alternatives to fishmeal-based diets. A major step in this direction is purchase feed from companies that demonstrate an environmentally sustainable approach to the formulation of their diets and the source of the ingredients.
Greenhouse gas emissions
Greenhouse gases are directly and indirectly released from salmonid farms through the burning of fossil fuels in machinery, pumps and other equipment and from the use of electricity. Greenhouse gas emissions can be minimised by using, where possible, gravity flow to move water and energy efficient buildings (e.g. insulated sheds and greenhouses). Using energy efficient equipment and utilising off-peak electrical periods wherever possible will also significantly reduce energy consumption.
Impacts of the environment on salmonid aquaculture
The open nature of most salmonid farms means they are vulnerable to impacts from the external environment. This section outlines environmental factors that can impact on salmonid aquaculture. The most serious risks relate to the quantity and quality of water supply as this can adversely affect the production system and welfare of stock held at a fish farm.
Water quantity
In most systems, water usage increases with the need to supply sufficient dissolved oxygen for the welfare and growth of the stock. Except for limited evaporative losses, salmonid farming, unlike many other agricultural or industrial users, is a volume neutral activity. That is, almost all water used is returned to the source supply channel.
In natural (i.e. unregulated) river systems the quantity of water available varies seasonally according to climatic conditions. Water levels in these rivers can be very low during extended periods of dry weather. The quantity of water in regulated rivers also varies seasonally, but in response to irrigation demands rather than climatic factors.
Water quality
Problems with the quality of influent water may occur naturally or as a result of human-related activities upstream. Surface water supplies are vulnerable to seasonal variations in temperature and quality related to climatic factors and rainfall (e.g. silt loadings). Farms are also vulnerable to upstream pollution which can also be a source of disease and parasites.
Best practice environmental management for salmonid farms
This section provide a summary of what Best Practice Environmental Management (BPEM) for salmonid aquaculture in Victoria. An essential requirement of BPEM for both new entrants and existing operators is compliance with all relevant regulatory responsibilities; however, regulatory compliance is only a starting point, and this alone will not lead to BPEM.
New entrants to the industry have the opportunity to address potential environmental issues prior to site development through site selection, farm design and construction practices. A checklist of issues for new entrants is given in Appendix 3. Existing salmonid aquaculture farms must implement management practices that will minimise environmental impacts to achieve BPEM. In the context of this report, 'BPEM' for salmonid farms may be defined as:
Minimising the waste stream by maximising production efficiency per unit production.
It must be recognised that the cost of adopting technologies for cleaner production needs to be offset by increasing production.
The waste management hierarchy
The Industrial Waste Management Policy (Waste Minimisation) 1990 (Environment Protection Act, 1970, section 1 (1I and 1J) reprint 14, July 2002 or later), sets out the following hierarchy for industrial waste management options:
- waste avoidance and reduction;
- re-use, recycling and reclamation;
- waste treatment; and
- waste disposal (Figure 7)
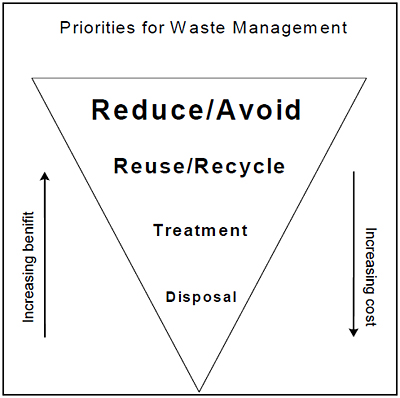
Figure 7: Waste management hierarchy
By focusing on waste avoidance and reduction through the implementation of better production processes and practices rather than on waste disposal, pollution control and waste disposal costs can be lowered, environmental impacts reduced and economic performance improved.
In the freshwater salmonid farming industry, waste minimisation principles can be applied to the waste streams identified in Section 2.
Table 7 lists these waste streams and the point in the waste management hierarchy that they can be most effectively addressed. The most important issue to salmonid farmers and regulators is the discharge of nutrients in effluent. Although management of other waste streams will be discussed nutrient discharge will be the main focus of this section.
Table 7: Waste streams from salmonid aquaculture considered with reference to the waste management hierarchy
| Waste stream | Avoidance/ reduction | Re-use/recycle | Treatment | Disposal |
|---|---|---|---|---|
| Organic matter and nutrients in effluent | ||||
| Sludge from settlement ponds | ||||
| Chemicals and therapeutants | ||||
| Fish mortalities and processing wastes | ||||
| Fish escapes | ||||
| Greenhouse gases |
Organic matter and nutrients in effluent
Organic matter and nutrient loads in effluent can be reduced by:
- reducing nutrient loads in effluent ; and
- effluent treatment technologies.
Reducing nutrient loads in effluent
Of primary concern in the waste stream from salmonid farms are nutrients (N and P) that originate primarily from aquaculture feed. Nutrient wastes in effluent can be effectively reduced through efficient feed management (i.e. as much fish as possible must be produced for a given amount of fish feed). By maximising the efficiency of the conversion of fish food into fish flesh, that is, minimising the feed conversion ratio (FCR), the waste stream generated by that process is minimised.
Feed management and water (oxygen) management are two interacting variables in flowthrough salmonid systems that have a profound influence on FCR. Appropriate management of these variables will result in a lower FCR and better environmental outcomes for the farm and will be considered in detail below.
Feed Management
Farming salmonids is generally viewed as being extremely efficient, as the retention of energy and protein by salmonids is high compared with terrestrial species (e.g. chickens and pigs).
Salmonids have significant advantages over traditional terrestrially cultured species because they are ectothermic (i.e. cold-blooded) and do not use as much energy maintaining their optimal body temperature. In the aquatic environment, salmonids exist in a state of neutral buoyancy, so little energy is used to counter the effects of gravity. These biological advantages mean retention of dietary protein and energy in salmonids is about twice that of chicken and pigs (Table 8) and wastage is lower.
Table 8: Percentage of energy and protein from feed that is retained in flesh (Asgard and Austreng, 1995)
| Salmonids | Chicken | Pig | |
|---|---|---|---|
| Energy | 27 | 12 | 16 |
| Protein | 30 | 18 | 13 |
Diet quality
Diet quality is an important determinant of FCR, and diets that are highly digestible, of high nutrient density and with a well-balanced protein: energy ratio are the most desirable for sustainable aquaculture (Cho et al., 1991). This is attained in salmonid aquaculture through the use of highenergy extruded diets. The combined effect of low FCR and low P levels in diets can have a profound effect on nutrient loads in the waste stream from salmonid aquaculture (Table 9).
Table 9: Influence of improved FCR and reduced P levels in diets on P waste loads from salmonid culture per tonne of fish produced
| Phosphorous (%) included in diet | ||||
|---|---|---|---|---|
| FCR | 1.6% | 1.4% | 1.2% | 1.0% |
| 2:1 | 27.5 kg | 23.5 kg | 19.5 kg | 15.5 kg |
| 1.5:1 | 19.5 kg | 16.5 kg | 13.5 kg | 10.5 kg |
| 1.0:1 | 11.5 kg | 9.5 kg | 7.5 kg | 5.5 kg |
Feeding rates
Adopting the appropriate feeding rate for salmonids is important in waste avoidance as both under- and over-feeding lead to an increase in FCR.
Different feeding strategies are adopted by farmers:
- feeding to demand;
- feeding from feed charts provided by the feed companies (i.e. a set percentage of feed per mass of fish per day); and
- a combination of both.
Commercial feed companies use growth-ration and FCR-ration curves similar to Figure 8 to develop their feeding guides, which are distributed to farmers.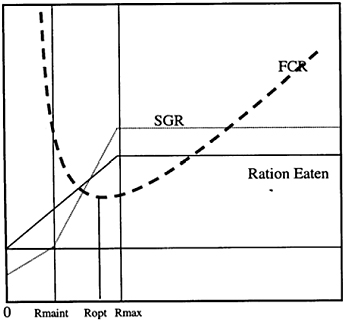
Figure 8: Growth ration and FCR curve used to determine optimum feeding rates (Anon 1998)
The specific growth rate (SGR) and FCR curves in Figure 8 show that the optimum feeding rate (Ropt) occurs where the FCR is minimised. Rmax is the point where FCR is minimised against maximum SGR. This point is the optimum economic feeding rate.Feeding beyond Rmax increases FCR as the SGR curve is flat beyond Rmax. In other words, the maximum rate at which salmonids will grow cannot be exceeded through extra feeding.
Feeding below Ropt compromises FCR, as maximum growth potential is not met and a larger proportion of the feed consumed is used in maintenance physiology.
It should be noted that the SGR-ration, FCR-ration curves, Ropt and Rmax are different for different sized fish and will vary with temperature. Feed companies usually supply a matrix of feeding rates taking account of these factors. It should also be noted that rainbow trout have a very flat FCR curve, which means that the zone between Ropt and Rmax is quite wide. In other words, a pond of trout may be fed as little as 0.8 percent or as much as 1.6 percent of body mass each day without compromising FCR.
Most feed tables are nearer the Rmax point (maximising economic return for farmers) than Ropt; while most farmers will generally hold more resident stock and feed at a lower body percentage (nearer Ropt).
Diet size and delivery
It is important to ensure that the appropriate rations are fed to different sized fish. If pellets are too big, swallowing and digestion will be compromised. If pellets are too small, the speed of delivery may increase beyond the rate at which the fish can consume them before they fall through the water profile. Un-eaten feed contributes only to the waste stream.
Nutrient mass balance models as a management tool
Auditing feed usage (in terms of quantity and quality) and biomass of salmonids produced provides a simple input-output model of waste generation. Similar models have been applied to salmonid industries overseas (e.g. Frier et al., 1995; Kelly, 1995) and have previously been used in the Victorian industry (Ingram, 1999).
Mass balance modelling is a pro-active management tool that allows fish farm managers to regulate feed input so that discharge licences are not breached. The quantity of N and P in influent water will be taken into account when estimating discharge effluent concentration. Using this approach, targets for increased efficiency or replacement of certain inputs can be assessed. It also provides valuable feedback to the farmer enabling them to optimise farm efficiency and FCR. Figure 9 illustrates the components of a nutrient mass balance model. A more detailed description of the data requirements for these models is given later in this section.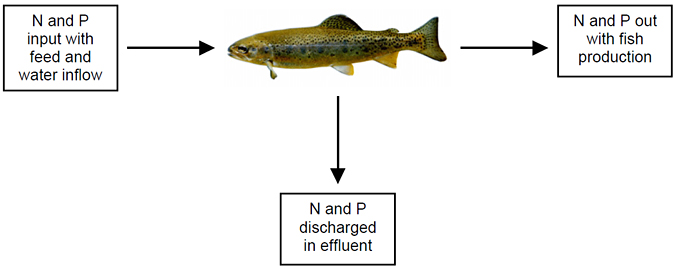
Figure 9: Nutrient mass balance model for salmonid aquaculture
Water (oxygen) management
Water flowing through aquaculture farms is the main supply of oxygen for the fish. The amount of oxygen available is directly proportional to the diverted flow and the oxygen concentration of the incoming water, which in turn limits the productive capacity of the farm. Managing the available oxygen appropriately has a significant impact on FCR and the consequent waste stream generated by the farm.
If satisfactory oxygen concentrations are not maintained, FCR increases as salmonids are forced to inefficiently metabolise feed anaerobically rather than aerobically.
For efficient, aerobic metabolism to occur, the oxygen in the blood of the fish must be at least 95 percent of saturation. This is directly influenced by water temperature. For example at 5°C dissolved oxygen concentrations in the water need to be only 42 percent of saturation to provide 95 percent of saturation in the blood; at 22°C the dissolved oxygen concentrations in the water must be at 100 percent of saturation.
Table 10 shows desired oxygen concentrations in discharge water at varying temperatures in order to achieve 95 percent of saturation in fish blood.
| Temperature (°C) | Oxygen concentration | Saturation (%) |
|---|---|---|
| 4 | 5.25 | 40 |
| 8 | 6.0 | 50 |
| 12 | 6.5 | 60 |
| 15 | 7.0 | 70 |
| 18 | 7.0 | 75 |
| 20 | 7.5 | 80 |
Table 10: Desired oxygen concentrations in discharge waters at varying temperatures (E. Meggitt, pers. comm.)
A detailed guide to preparing and managing oxygen budgets for salmonid farming is given later in this section.
Balancing production, FCR and water availability to ensure BPEM
Efficient feed and water (oxygen) management can result in low FCR. If production is too high the discharge is more likely to have a negative environmental impact. Nutrient mass balance models and oxygen budgets will give farm managers a good indication of what the system can produce.
Three key ratios provide rule-of-thumb indications of the carrying capacity of a salmonid farm:
- Standing stock (tonnes): diversion inflow (ML per day) = approximately 1:1
- Standing stock (tonnes): annual production (tonnes) = approximately 1:3
- Annual production (tonnes) to daily inflow (ML) = approximately 3:1
These ratios apply where no supplementary oxygen is used. As more oxygen is added to the system, through use of aerators, cascading, and oxygen diffusion, production capacity increases. Salmonid farm managers must be extremely careful not to breach EPA licence conditions by increasing oxygen budgets and not considering the increase in nutrient discharges.
A flow chart that details routes to achieving BPEM in terms of nutrient discharges is shown in Figure 10.
Figure 10: Decision-making framework for reaching best practice in nutrient dischargeView Figure 10: Decision-making framework for reaching best practice in nutrient discharge
Waste treatment
Wastewater from salmonid farms is technically difficult to treat as it differs considerably in composition from urban wastewater, where most technology is derived. The three major constraints to effectively treating wastewater from salmonid farms are:
- comparatively low nutrient concentrations;
- small waste particle sizes; and
- variable ratio of solid to soluble components compared with urban wastewater systems.
In Victoria, most farms use passive sedimentation ponds to treat wastewater before discharge. In European salmonid aquaculture, there was a trend towards mechanical microscreen filtration technology during the 1990s, but this technology has not been adopted by the Australian industry. Sedimentation options available to the Victorian industry include ponds to treat effluent prior to discharge and settlement cones placed at the pond outlet to capture solids in the outflow.
The efficiency of sedimentation treatment systems will be directly related to their design, maintenance and management. As effluent treatment becomes more efficient and well- managed, the volume of sludge from these systems will increase. This sludge has to be managed in an appropriate manner.
Dissolved nitrogenous waste products (mainly ammonia) are also important components of aquaculture effluent that farms must keep at levels below that specified in their EPA discharge licence. Levels of ammonia in effluent can be reduced by selecting extruded diets that improve gross protein and energy retention (Lanari et al., 1995). Other factors such as the size of the fish, water temperature, feeding rates and stress are also important contributors in ammonia production rates (Kelly et al., 1994). Biofiltration utilising nitrifying bacteria is one treatment option to reduce ammonia levels in effluent. In biological filters, colonies of nitrifying bacteria, maintained on filter media in trickle or submerged filter beds, convert ammonia to nitrate. This process does not remove total N from the system, but it will convert ammonia to less toxic forms and reduce levels in effluent waters. Best practice measures for reducing nutrient loads in effluent are summarised in Table 11.
Table 11: BPEM to reduce net nutrient loads in effluent and maximise production
|
Settled solids from ponds and treatment facilities
De-silting of production ponds and effluent treatment systems will result in an organic sludge that must be removed. Options for dealing with sludge from de-silting include:
- minimising sediment production on-farm
- re-use of sludge
- treatment options
- minimising impacts of sludge disposal.
Minimising sediment production on farm
Farmers should try to reduce production of solid wastes on-farm through improved feed management and appropriate production techniques, such as stocking densities. Control of erosion on-farm will also reduce sediment loads. Once removed from ponds, sediments must be stored in an appropriate area, re-used, treated or disposed of.
Re-use of sludge
Recycling and re-use is the preferred option for disposal of sludge and solid wastes, and options for the use of these products as an agricultural fertiliser should be investigated. Sludge used for fertiliser should be spread on land far enough from watercourses to ensure the flows and associated erosion does not reach the water. Further information on recycling organic material is provided in the EPA guidelines for composting
and other organic recycling facilities (EPA, 1996). AHigh nutrient concentrations and disease organisms contained in farm sludge are not a risk to the environment or other fish farms when sludge is composted. Land containing composting facilities should be protected from uncontrolled overland water flows.
Treatment options
To reduce the volume of sludge requiring transport or disposal, farmers may de-water sludges. The extent of de-watering will depend on the method of transport, as a dry matter content of more than 10 percent will be difficult to pump. To collect enough sludge to transport, storage of sludge may be required. Direct disposal of raw sludge should be in an approved landfill. Stabilisation of sludges will be required in landfill areas to halt putrefaction, reduce offensive smells and kill pathogenic species. Stabilisation is achieved by using lime or slaked lime to a pH of at least 12 for 24 hours. Tests may be required to show that this is adequate for local conditions and specific sludge components.
Minimising impacts of sludge disposal
Sludges may be disposed to designated areas on farms and these areas should be located where the potential for leaching is minimal. If required, the ponds should be lined to prevent the escape of liquid. Disposal to municipal landfill should be explored only after all other options have been considered.
Best Practice measures to reduce the impacts of sludges are detailed in Table 12.
Table 12: BPEM to reduce impacts of sludge from ponds and treatment facilities
|
Chemicals and therapeutants
Impacts associated with the use of chemicals and therapeutants can be reduced by:
- minimising the use of chemicals and therapeutants; and
- minimising the risk of accidents and spills.
Minimising the use of chemicals and therapeutants
Chemicals and therapeutants should only be used when required. The need to use therapeutic chemicals (e.g. formalin and salt) can be minimised by reducing the risk of disease outbreaks through good husbandry practices. Maintaining good water quality and environmental conditions, good stock management, fish health and quarantine protocols are key ways to minimise use of therapeutic chemicals.
Minimising the risk of accidents and spills
Chemicals, therapeutics and medicines should be stored in dry, well-ventilated facilities to avoid degradation. Stores should be secured to stop access by foraging animals and unauthorised personnel.
Hazardous chemicals, though rare on fish farms, should be labelled as such, and stored in secure containment facilities with bunding as required (EPA 1992a), to avoid accidental seepage or discharge. Storage sites located close to a watercourse should be avoided or may require extra protection. Farmers should only use chemicals and drugs that are exempt from registration or authorised by the Australian Pesticides and Veterinary Medicines Authority (APVMA).
Disposal of chemicals and management of chemical spills should be undertaken in accordance with guidelines and recommendations provided by the manufacturers (i.e. Material Safety Data Sheet (MSDS)). Farmers should keep a spill kit in the chemicals storage area and ensure spills are cleaned up immediately.
Best Practice measures to reduce on-farm chemical use and the risk of accidents or spills are detailed in Table 13.
Fish mortalities and processing wastes
Impacts associated with fish mortalities and processing wastes may be minimised by:
- reducing stock mortalities;
- recycling and re-using stock mortalities and processing wastes; and
- disposal.
Reducing mortalities
Fish mortalities are unavoidable in aquaculture and occur in all facilities from time to time. Sustained or larger losses can be reduced by good fish husbandry that minimises stress to the fish and the risk of disease outbreaks. The Victorian Trout association Industry Code of Practice (VTA, 1998) details a holistic management approach to dealing with fish health issues including water quality management, hygiene (including quarantine of new stock), feed management, aeration, predator control and fish husbandry.
The onus is on the farmer to maintain a healthy environment for the stock and avoid the introduction and spread of disease. Maintaining an appropriate buffer area between stock and wild fish is important to reduce the risk of disease transfer to cultured stock.
Table 13: BPEM to reduce chemical use and the risk of accidents or spills
|
Recycling and re-use of mortalities and processing wastes
The Victorian salmonid industry generates approximately 235 tonnes of processing waste per year. The traditional options for re-use of fish wastes include (Puglisi, 1991):
- materials for human food products (i.e. fish mince products);
- feed and fertiliser products (i.e. fishmeal, hydrolysed products and composting); and
- products for niche markets (e.g. skins, heads and frames and scales).
Large quantities of raw materials are required for most of these options before they are economically viable. Expensive, dedicated processing plants may be required. The two most practical options for recycling fish wastes are rendering and composting.
Commercial rendering and composting
There are many commercial rendering and composting operations in Victoria but most have minimum collection loads of approximately 20 tonnes making this method of disposal impractical for many small farmers. Research is required into on-site methods of stabilising fish wastes so that they can be stored prior to bulk transportation and or value adding.
On-site composting
On-site composting appears to be the most viable waste disposal option for the salmonid industry in Victoria. Small-scale trials have been carried out by the industry with promising results although the logistics of scaling up to commercial composting volumes are unknown. Compost is easy to handle, stores well, has few odour problems and has commercial value as a fertiliser. As fish processing waste is high in moisture it is usually necessary to mix it with materials that can absorb this excess moisture (e.g. sawdust and straw) (IWMGAO, 1996). Prior to using composting, consideration should be given to the following areas (EPA, 1996):
- selection of appropriate technology;
- siting of facility;
- air quality, with respect to odour, gas emissions and dust emanating from the site;
- water quality, in particular groundwater protection, but also stormwater and leachate management, and soil protection; and
- other considerations, including rodents, flies and birds.
Disposal of processing wastes and mortalities
Final disposal of processing wastes and mortalities when all other options have been excluded includes burial in on-site pits or disposal to landfill. Pit disposal of mortalities and processing wastes is no longer considered appropriate by the EPA and alternative methods should be investigated (DPI, 2003). A permit is required from the EPAbefore a burial pit can be constructed.
Under the Environmental Protection Act, 1970, fish wastes are prescribed industrial wastes (EPA, 1998) and an EPA-permitted vehicle must be used for transportation. Only certain landfill sites can accept prescribed wastes and local authorities can provide information about which sites will accept wastes. Table 14 details Best Practice measures to reduce impacts from mortalities and processing wastes.
Fish escapes
Escapes of farmed fish are avoided through installation and proper maintenance of screens in each section of the farm including inflow and outflow channels. The screen grid size should be selected according to the size of stock to be
Table 14: BPEM to reduce impacts from mortalities and processing wastes
|
retained within a given culture unit. To prevent ingress of wild fish through outflows, a range of sequential screen sizes, with the largest screen size the farthest from the farm, may be required.
Wild fish are attracted to farm sites by feed in the outflow water. Minimisation of feed losses will contribute towards reducing stock interactions. Outflow channels, where mechanical filtration devices are properly fitted, can be considered secure against loss or ingress of stocks.
Table 15 details measures to reduce impacts from fish escapes.
Greenhouse gas emissions
Increasing the energy efficiency of a salmonid farm will reduce emissions and costs and increase profitability. Measures to reduce greenhouse gas emissions and comply with EPA requirements include:
- conducting an energy audit;
- adopting an environmental management plan to reduce energy consumption; and
- increasing the efficiency of on-farm practices.
A complete step-by-step process is further defined in the Sustainable Energy Authority Victoria .Energy and Greenhouse Management Toolkit. Series.
Best Practice measures to reduce greenhouse gas emissions are detailed in Table 16.
Other environmental issues
Some of the issues identified in Section 4 cannot be addressed using a waste minimisation strategy. Methods for reducing impacts related to these issues are outlined below.
Water abstraction
The impacts of water abstraction may be minimised by the following measures:
- environmental flows between intake and outlet structures should be maintained throughout the year to ensure aquatic habitats are protected and to allow passage of aquatic organisms including migrating fish;
- the distance between inflow and outflow structures should be minimised;
- changes in ambient current strength and distribution as a result of abstraction should be minimised; and
- the proportion of stream flow diverted to farm should be monitored and managed to minimise impacts.
Partial water re-use or recirculation is already being used in the industry and can be applied at most sites. In its simplest form, re-use involves passing water from one culture pond to another with little conditioning of the water between the ponds. More complex water recirculation systems comprise units (e.g. filters, screens and oxygenation or aeration equipment) that treats the water prior to recycling it back through the growout structures.
Generally, freshwater salmonid farms are designed and operated as single pass systems, were water flows between ponds. Water re-use requires additional equipment and energy usage to pump the used water back to the intake level or intermediate points within the system. Re-use may decrease the cost of wastewater treatment, as a smaller treatment plant will be required for the reduced volumes of total water discharged.
Table 15: BPEM to reduce impacts from fish escape.
|
Table 16: BPEM to reduce greenhouse gas emissions
|
Water recycling can be easier to implement at new sites than existing sites as it may be costly to convert or retro-fit systems. In practice, few sites completely recirculate water, but rely on re-using part of their flow mixed with fresh inflow water to make up to the total required volume. The major limitation to re-use and recirculation is the change to water quality on passage through the system. As most treatment systems can only deliver a partial reduction or removal of unwanted waste components, the final outflow concentrations of nutrients is increased compared to single pass systems.
The impact of this nutrient increase on the receiving watercourse must be balanced by improvements resulting from reduced abstraction. Prior to re-use, re-oxygenation and removal of metabolites (e.g. CO2 and NH4+ /NH3) may be required. Partial mixing or dilution with fresh inlet water can, in many instances, prove sufficient, but output of metabolites is highly dynamic and requires careful monitoring to maintain optimal water quality.
Table 17 details measures to reduce impacts of water abstraction.
Minimising impacts on habitats during construction and operation
Impacts on habitats during construction and operation can be minimised by adhering to the conditions of building and planning permits (see Table 18).
Minimising impacts on birds and other predators
Predators must be managed to minimise impacts to native fauna while protecting the economic viability of the trout farm.
Acceptable practices for control of water rats and birds are outlined in Table 19 (VTA, 1998). Best practice for minimising impacts on birds or other predators are summarised in Table 20.
Table 17: BPEM to reduce impacts of water abstraction
|
Table 18: BPEM to reduce impacts on habitats
|
Minimising visual impacts
Visual impacts of the site can be minimised by ensuring litter is kept to a minimum and used materials (feed bags, packaging) are appropriately stored or disposed of. If required, the site can be screened with trees to camouflage operations.
Aesthetic concerns can be minimised through good site selection and management. Feed bags, ice cartons and other forms of packaging may create litter at a site. Secure storage of used or damaged materials can eliminate this problem. Best practice measures to reduce visual impacts are summarised in Table 21.
Minimising noise
Minimise machinery use in sensitive areas at sensitive times and, if required, muffle noisy machinery. Noise control guidelines for rural areas have been developed (EPA, 1989) and impacts can be minimised by changing operating hours of machinery.
Best practice management to limit impacts of noise are detailed in Table 22.
Minimising odours
Odour problems may be addressed through the appropriate treatment and disposal of mortalities, processing wastes and pond sediments. Odour control can best be achieved at fish farms by isolation and removal of odour sources.
Best practice management to limit impacts of odours are detailed in Table 23.
Table 20: BPEM to reduce impacts on birds or other predators
|
Table 21: BPEM to reduce visual impacts
|
Table 22: BPEM to reduce noise
|
Table 23: BPEM to reduce odours
|
Compliance, monitoring, recording and reporting
To comply with the conditions of licences granted by the EPA, Rural Water Authority and The Victorian Fisheries Authority, records must be kept. Each agency requires annual reporting of farm performance against licence conditions. In addition, monitoring of key variables (such as feed input and oxygen) will allow farmers to assess the efficiency of operations at the site and allow pro-active management of potential problems.
The main variables that should be monitored regularly by salmonid farmers are summarised in Table 24.
Compliance with EPAdischarge licence conditions
Current EPA discharge licences require that salmonid farmers monitor effluent quality by sampling inlet and outlet water four to six times per year. Samples are analysed by a National Association of Testing Authorities (NATA) certified laboratory and forwarded to the EPA to ensure licence compliance.
The large daily and seasonal variations in waste output can render compliance sampling on the basis of discrete samples inadequate. Natural variation in the inflow water and time required for water passage through a farm creates a complex relationship that may not be easily resolved. further consequence is that discharge quality improvements through changes in farm practice are not easily observed.
Measuring improvements in environmental performance cannot be achieved through water quality surveillance alone. The use of feed and production auditing and application of nutrient mass balance models, in addition to periodic surveillance of water quality, represents BPEM for fish farms (Table 25).
Table 24: Data that should be collected for monitoring and reporting purposes
| Frequency | Parameter | Source/comment |
|---|---|---|
| Daily |
|
|
| Weekly |
|
|
| 2-Monthly |
|
|
| 6-Monthly |
|
|
| Annual |
|
|
| Other |
|
|
Table 25: BPEM for compliance, monitoring, recording and reporting
|
Data required for nutrient mass balance models
Nutrient mass-balance models are a useful tool for managers and regulators to check compliance with discharge licences. The data that is required to perform a nutrient mass balance model for a theoretical farm that has a diversion licence of 30 ML and produces 100 tonnes of fish per year at an FCR of 1.2:1 are summarised in Table 26.
In this scenario, although the level of P in effluent discharged (0.09 mg/l) is below the permitted levels, it is significantly above the highest of the SEPP objectives for high quality streams (<0.025 mg/l for the 75th percentile). The licence requirements for this discharge would require a substantial mixing zone, especially if a significant proportion of the stream flow is diverted for the farm.
Developing oxygen budgets
As discussed earlier, oxygen budgets can be used to minimise FCR by calculating the oxygen availability in the water and determining feed inputs on the basis of that calculation. The amount of oxygen delivered into a salmonid farm is quantifiable, as is the demand for oxygen by the fish. If the fishes' demand for oxygen exceeds the supply, the results can range (depending on oxygen deficit) from mass mortalities due to asphyxiation, stress induced disease outbreak and compromised FCR due to anaerobic metabolism of feed.
Oxygen demand of the fish
The amount of oxygen required by fish is dependent upon water temperature, size, activity and, most significantly, feeding rates. Table 27and Table 28 show the oxygen requirements of feed for trout (Warrer-Hansen, 2002) at various temperatures. Table 27, shows that above 10°C the amount of oxygen required to metabolise a given amount of feed increases sharply. Table 28 calculates the total amount of oxygen required for a 1 tonne population of trout that are fed according to the feeding guide.
Table 26: Summary of data required for a theoretical farm to use a mass balance model approach to meeting discharge licence conditions
| Inputs | Outputs | ||
|---|---|---|---|
| Feed used at FCR 1.2:1 | 120 tonnes | Fish production | 100 tonnes |
| Feed Quality | P in fish | 0.05% | |
| P content | 1.20% | N in fish | 0.30% |
| N content (16% protein N) | 45% protein | ||
| P input to system | 1.44 tonnes | P output from system | 0.48 tonnes |
| (120 t feed x 1.2/100 P in feed) | |||
| N input to system | 8.64 tonnes | N output from system | 3 tonnes |
| (120 t feed x 45% protein x 16% N) | |||
| Calculation of P in discharge water | Notes | ||
| P in discharge = Pin - P out (total annual load) | 0.98 tonnes | 1.44 - 0.48 tonnes | |
| (980 kg) | |||
| Concentration of P in discharge | 0.09 mg/l | P load in discharge/ water diversion per year 980/(30 x 365) | |
| Calculation of N in discharge water | |||
| N in discharge = N in - N out (total annual load) | 5.64 tonnes | Ammonia represents 33% of total N discharge (1.88 tonnes) | |
| Concentration of ammonia in discharge | 0.17 mg/l | 1,880 kg/(30 x 365) | |
Table 27: Oxygen required, in kilograms, to metabolise one tonne of feed (23 MJ) (Warrer-Hansen, 2002)
| Water Temperature (ーC) | |||||||||
|---|---|---|---|---|---|---|---|---|---|
| Fish Size | 2 | 4 | 6 | 8 | 10 | 12 | 14 | 16 | 18 |
| 15-50 g | 347 | 348 | 343 | 343 | 346 | 355 | 372 | 395 | 440 |
| 50-150 g | 380 | 382 | 375 | 380 | 379 | 389 | 406 | 433 | 483 |
| 150-400 g | 446 | 438 | 420 | 437 | 434 | 450 | 463 | 495 | 551 |
Table 28: Daily oxygen requirement, in kilograms, per tonne of trout at various water temperatures (Warrer-Hansen, 2002)
| Water Temperature (ー°C) | |||||||||
|---|---|---|---|---|---|---|---|---|---|
| Fish Size | 2 | 4 | 6 | 8 | 10 | 12 | 14 | 16 | 18 |
| 15-50 g | 3.2 | 3.9 | 4.6 | 5.4 | 6.2 | 7.1 | 8 | 8.7 | 9.2 |
| 50-150 g | 2.5 | 3.1 | 3.6 | 4.3 | 4.9 | 5.6 | 6.3 | 6.9 | 7.3 |
| 150-400 g | 2.1 | 2.5 | 2.9 | 3.5 | 4 | 4.6 | 5.1 | 5.6 | 5.9 |
nb: Trout not fed require only 25 percent of the oxygen requirement shown here
Oxygen supply to the farm
The amount of available oxygen from the diverted flow through the farm is largely a function of water temperature and flow rate. Table 29 shows the amount of available oxygen (mg/l) that can be used for salmonid production at 12°C when the influent water is at 100 percent saturation and the effluent water at 60 percent.
The oxygen available to the farmed fish in this situation is 4.26 mg/l. The available oxygen in kilograms can be calculated by multiplying the daily diversion flow by the available oxygen (in mg/l). For a 30 megalitre per day diversion flow, the amount of available oxygen is 127.8 kg per day.
Table 27 shows that approximately 400 g of oxygen is required to metabolise one kg of feed at 12°C, which means that this farm should use about 320 kg of feed per day (127.8/0.4).
At 12°C, feed charts recommend that about 1.8 percent (Rmax) of body mass per day should be fed to trout for a 23 MJ diet although experience suggests average feeding rates of about one percent (Ropt) are appropriate. This means a standing stock of approximately 32 tonnes of fish can be maintained on the farm. If these conditions were replicated 365 days of the year, 116.8 tonnes of feed is fed and 100 tonnes of fish are produced at an FCR of 1.17.
Table 29: Oxygen saturation and availability in the inflow and outflow of a water supply
| Water temperature (°C) | Oxygen (mg/l) at 100 percent saturation | Oxygen (mg/l) at 60 percent saturation | Available oxygen (mg/l) |
|---|---|---|---|
| 12 | 10.76 | 6.5 | 4.26 |
Environmental management system.
The next logical step for salmonid farmers operating at best practice levels is to prepare a site- level environmental management system (EMS). An Environmental Improvement Plan (EIP - which is a form of EMS) is required from all farmers by the EPA as part of their discharge licence.
An EMS is essentially a process used to manage environmental impacts, risks and opportunities (Seafood Services Australia, 2002). It can be tailored to suit individual circumstances and the degree of complexity will depend on intended use. An EMS can be a simple plan developed at farm- level to address a specific issue or can be a comprehensive third party certified system complying with international standards, such as ISO14000.
An eight-point plan (Figure 10) for developing an EMS for the seafood industry has recently been developed (Seafood Services Australia, 2002). This plan also offers practical advice and templates for organisations interested in implementing an EMS (www.seafoodems.com.au).
This section summarises the key elements of this plan as they may be applied to the salmonid aquaculture industry2.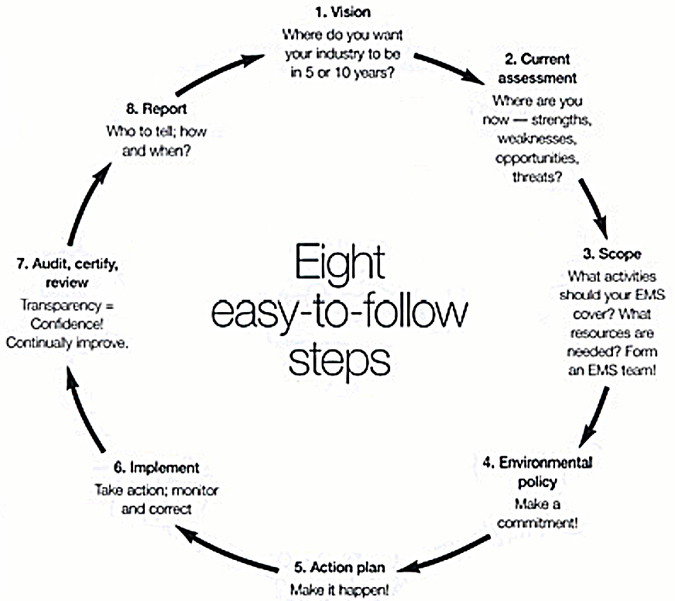
Figure 11: Eight point plan for developing an EMS (SSA, 2002)
2 Abridged from SSA, 2002. .Take your pick . the Seafood EMS Chooser., with permission from Seafood Services Australia, February 2004.
Vision
An EMS is a public commitment by a company to improve its environmental performance. Before developing an EMS, farmers should have a clear idea of its purpose and their goals over the next five to 10 years. This will help determine the scope of the EMS and the activities required. For example, the objective of an EMS may be to compile an EIP to comply with the EP discharge licence for the site.
Much of the thinking that goes into the development of an EIP is also applicable to an EMS - the key difference is the community focus of the EIP. EIP are a reflection of the community.s right to know about the environmental impacts of industry and the development process provides for openness between the company and the community.
When the objective of the EMS have been decided, a vision statement should be written that clearly states what farmers would like their industry to look like in the future. It should be credible and achievable in the timeframe specified.
Current assessment
When developing an EMS, farmers must assess their current situation and the issues that are important to their organisation. This involves identifying important environmental issues and planning how to improve performance.
Farm plan
Draw a plan of the aquaculture site showing all major infrastructure components. The water intake and outlet points should be clearly marked. Refer to .Freshwater salmonid industry in Victoria. section of these guidelines and document the layout of infrastructure on the farm including:
- fish production ponds and raceways (e.g. number, area, depth, layout);
- nursery ponds (e.g. number, area, depth, layout);
- hatchery buildings (e.g. total area, number of tanks, size of tanks);
- broodstock holding facilities (e.g. number, area, volume);
- waste treatment ponds (e.g. number, area, depth);
- processing buildings (e.g. area); and
- storage areas (e.g. number, area, use).
Water flow through the farm
Summarise all data collected on water intake and discharge in previous years including:
- how water flow is measured;
- data on the waterway particularly frequency and duration of low flows; and
- water exchange rates in various parts of the farm.
Fish
The number and source of fish brought onto the farm should be documented as well as quarantine procedures. If juveniles are hatched on-site, estimate the number produced each year. The intensity of fish production may be important in determining environmental impacts.
Records should include:
- stocking densities of fish held at different stages and times of the year;
- standing crop held at different times of the year; and
- fish production of each size class over the year.
Fish production and feeding
Review previous fish production records at the site, including fish production, mortalities and FCR. These data will be important in the future to demonstrate any improvements.
Also consider:
- diet types and purpose;
- feeding methods;
- decisions on feeding rates . use of nutrient budgets and oxygen management practices; and
- systems to monitor FCR.
Use of chemicals and therapeutants
Document chemicals and therapeutants held on site, their use and storage. Table 1 provides a starting point for this process.
Effluent characteristics
Collate all data previously collected during routine monitoring of effluent quality and evaluate if there have been instances of non-compliance.
Consider:
- is this a regular or rare occurrence?
- are incidents of non-compliance in response to any extreme conditions or accidents on site?
Pond cleaning and sludge management
Consider:
- frequency that ponds, filters and sediment ponds are cleaned; and
- methods of cleaning ponds, filters and sediment ponds; and
- current procedures for dealing with the sludge.
Fish mortalities and processing wastes
Consider:
- volumes of fish mortalities and processing wastes; and
- methods used for waste disposal.
Fish escapes
Consider:
- the maintenance schedule used to ensure that screens are kept in good condition;
- occurance of large-scale escapes; and
- complaints from the public about escaped fish.
Greenhouse gas emissions
Has an energy audit been conducted at the site?
Other environmental issues (e.g. predators, visual impacts, noise and odours)
These issues may be significant at some sites. Consider any complaints that been received to suggest these issues are important to the community.
Personnel chart
This should give a clear indication of all staff in the organisation, their roles and responsibilities.
Assessment of current performance
This will provide a useful baseline to start developing the EMS. The output of the assessment should give a clear picture of the strengths and weaknesses of the operation. Farmers should give some thought to improvements wanted and opportunities that could be exploited to make this happen. A list of potential impediments should also be made. Two key areas to evaluate in the first instance are:
- Compliance with legislation
A prerequisite of EMS is compliance with all relevant legislation. Review the conditions of your licence from The Victorian Fisheries Authority, EPA and Rural Water Authorities. If farms do not comply with any licence conditions this will need to be addressed as part of the EMS.
- Data collection and recording
Assessment of current performance should highlight if farmers are currently collecting enough data to adequately monitor environmental performance. If not, improving data collation and recording will be part of their EMS.
Scope of EMS
The scope of the EMS defines activities for which farmers will be responsible. It should include all activities that may have an existing or future impact on the environment.
The 'Identifying and evaluating environmental issues' section of these guidelines gives details of environmental issues related to freshwater salmonid culture. Farmers should review the issues presented in light of the current assessment and identify which issues are most relevant to the site. These issues should be listed in order of priority . this will help identify relevant activities for the EMS. For most farms, reducing nutrient wastes in effluent will be a priority; however other issues will also need to be considered.
An EMS should include:
- undertakings to comply with, or go beyond, compliance with licences and regulations;
- emissions and waste production standards;
- monitoring and compliance;
- audits and assessment;
- improvement project details including what needs to be done, how and when it will be done;
- provisions for upgrading of plant;
- assessment of new and emerging technologies;
- emergency and contingency plans;
- enhanced response to community complaints;
- community relations, health and safety issues; and
- community reporting requirements on progress.
Environmental policy
An Environmental Policy is a statement of commitment to managing environmental impacts. It gives a focus for the environmental efforts of the organisation and establishes a framework for specific actions. The Environmental Policy should state what farmers want to achieve and commit to addressing identified impacts and opportunities.
Action plan
This step turns the policy into concrete actions and is a blueprint for future activities.
The list of issues identified as priorities in the .scope of EMS. stage should be used to review the .Best Practice Environmental Management for salmonid farms. section of these guidelines.
Each issue should have applicable best practice measures and suggest ways to achieve them. For example, if, through the current assessment, nutrients in effluent have been identified as a concern, farmers should work through the decision tree in Figure 10 to identify the root cause of the problem and measures to remedy it.
The aim of the action plan is to make operational the best practice measures outlined in these guidelines. When complete it will provide a list of actions that have to be taken, by whom and when. It delineates responsibilities for making things happen so everyone understands their responsibilities. The action plan also provides the basis for a powerful communication strategy.
Implementation
Implementation of the plan includes monitoring of activities and making changes as required.
Audit, certification and review
The program chosen to assess the performance of the EMS should directly relate to the level of confidence farmers want customers, the community or government to have in their performance. Third party certification of performance against international standards will ensure customers have confidence in the certification.
As with an EMS, an EIP is a dynamic process requiring effective collaboration with all involved.
Once a plan has been completed it requires ongoing monitoring by the company, the community and regulatory agencies to ensure focus is maintained.
Report
If the EMS is designed to comply with an EPA discharge licence, the end-point of the process will be an annual report. Important data that should be included in this report are outlined in Table 24:
- fish production, by species, production level and size (g);
- feed quality, FCR and water use;
- nutrient mass balance models of production on site to give waste loading per unit production and estimates of effluent quality (accounting for N and P levels in inflow water);
- discharge water quality monitoring results (two analyses monthly);
- relationships between production and water use;
- chemical and drug use;
- notifiable disease outbreaks;
- large scale mortalities;
- any changes to practices that have resulted in reduced waste loading or increased production efficiency; and
- new technologies adopted that will reduce waste loading or increase production efficiency.
When performance is demonstrably improving, farmers should consider informing target audiences. This will improve the farm.s image as a responsible operation.
References
Ackefors, H and Enell, M 1994. The release of nutrients and organic matter from aquaculture systems in Nordic countries. Journal of Applied Ichthyology 10., 225-241.
Anon 1998. Feed Management Guidelines for Salmonids. Gibsons Ltd., Rosnt Tasmania.
Anon 2004. Fisheries Division, NRE Commercial Fish Production Information Bulletin 2004. Marine and Freshwater Resources Institute, Victoria, Australia, Queenscliff. 31. pp.
ANZECC 2002. Australian and New Zealand Environment and Conservation Council. Canberra.
Asgard, T, & Austreng, E 1995. Optimal Utilisation of Marine Proteins and Lipids for human interests. In: Reinertsen, H & Haaland H. (Eds) Sustainable Fish Farming: 79-87, Rotterdan, Balkera.
Axler, RP Tikkanen, C Henneck, J Schuldt, J McDonald, M E 1997. Characteristics of effluent and sludge from two commercial rainbow trout farms in Minnesota. The Progressive Fish-Culturist, 59: 161-172.
Bergheim, , Kristiansen, R, and Kelly, L 1993. Treatment and utilisation of sludge from landbased farms for salmon. In: Techniques for Modern Aquaculture. Proceedings of an Aquacultural Engineering Conference. (Ed. by J.K. Wang). American Society of Agricultural Engineers, St Joseph, MI., Spokane, WA (USA). Pp 486.495.
Beveridge, MCM, Phillips M J and Clarke R M 1991. Aquantitative and qualitative assessment of wastes from aquatic animal production. In: D E Brune and J R Tomasso (eds) Aquaculture and water quality, Advances in World Aquaculture Vol. 3, World Aquaculture Society, Baton Rouge, Louisiana, pp. 506.533.
Cho CY, Hynes, JD, Wood, KR & Yoshida HK 1991. Quantitation of fish culture wastes by biological (nutritional) and chemical (limnological) methods; the development of high nutrient dense (HND) diets. In: Nutritional Strategies and Aquaculture Wastes (ed. By C.B. Cowey & C.Y. Cho), 37-50. Proceedings of the 1st International Symposium on Nutritional Strategies in Management of Aquaculture Wastes, Guelph Ontario, Canada. Fish Nutrition Research Laboratory, University of Guelph, Canada.
Clements, J 1988. Salmon at the Antipodes. Published by John Clements, Ballarat, Australia.
Cripps, SJ 1994. Minimizing outputs: treatment. Journal of Applied Ichthyology. Vol. 10 pp. 284-294.
DNRE 2002. Healthy rivers, healthy communities and regional growth. Victorian River Health Strategy. Department of Natural Resources and Environment, State Government of Victoria. Melbourne. August 2002..
DPI 2003. Interim Drought Response: Farmed Fish Kill Response Plan. Department of Primary Industries (Vic.). State Government of Victoria. Melbourne.
DPI 2005. Planning Guidelines for Land Based Aquaculture in Victoria. Fisheries Victoria Report Series No. 21. Department of Primary Industries, Melbourne.
EPA 1990. Industrial Waste Management Policy (Waste Minimisation). See Section 1 (1I and 1J) of the Environment Protection Act, 1970, Reprint 14, July 2002 (or later).
EPA 1992a. Bunding Guidelines. Environment Protection Agency Publication Number 347.
EPA 1989. Interim Guidelines for Control of Noise from Industry in Country Victoria. Environment Protection gency. Publication Number N3/89.
EPA1996. Environmental Guidelines for Composting and other Organic Recycling Facilities. Environment Protection Agency Publication Number 508.
EPA1998. Environmental Protection (Prescribed Waste) Regulation. Environment Protection Agency Publication No. 623.
FAO 2002. The State of World Fisheries and Aquaculture. Food and Agriculture Organisation of the United Nations, Fisheries Department, Rome. 150 pp.
Frier, JO, From, J, Larsen, T & Rasmussen, G 1995. Modelling waste output from trout farms. Water Science Technology. Vol.31, No. 10. pp.103-121.
Gavine, FM, Rennis, D S and Windmill, D 1996. Implementing environmental management systems in the finfish aquaculture industry. Journal of Chartered Institute of Water and Environmental Management. 10, p 341-347.
GBWQWG 1995. Nutrient Loads from Intensive Animal Industries in the Goulburn Broken Catchment. Goulburn Broken Water Quality Working Group Issues Paper No. 3.
Henry, GW, & Lyle, JM (Eds). 2003. The National Recreational and Indigenous Fishing Survey. FRDC project No. 99/158.
Ingram, BA (Ed) 1999. Towards Best Practice in Land-based Salmonid Farming: Options for Treatment, Re-use and Disposal of Effluent. Marine and Freshwater Resources Institute, Alexandra. 121 pp.
IWMGAO 1996. Idaho Waste Management Guidelines for Aquaculture Operations. Division of Environmental Quality, Idaho. 81 pp.
Kelly, L 1995. Predicting the effect of cages on nutrient status of Scottish freshwater lochs using mass-balance models. Aquaculture Research. Vol. 26, pp. 469-477.
Kelly, LA, Bergheim, A, & Hennessy, MH 1994. Predicting output of ammonium from fish farms. Water Research. Vol. 28, No. 6 pp 1403-1405.
Kelly, LA, Stellwagen, J and Bergheim, 1996. Wasteloadings from a freshwater Atlantic salmon farm in Scotland. Journal of the American Water Resources Association, 32. 5. October 1996.
Lanari, D, D.Agaro, D & Ballestrazzi, R 1995. Dietary N and P levels, effluent water characteristics and performance in rainbow trout. Water Science Technology Vol. 31, No. 10, pp. 157-165.
Love, G. and Langenkamp, D 2003. Australian Aquaculture: Industry Profiles for Related Species, ABARE Report 03.8, Prepared for the Fisheries Resources Research Fund, Canberra, May.
Masser, MP, and Lazur, 1997. In-Pond Raceways SRAC Publication No. 170. Southern Region Aquaculture Centre, Alabama Cooperative Extension System. 8 pp.
Metzeling, L 1999. The impact of fish farm effluent on stream ecosystems . some results from EP studies. In Ingram, BA (Ed). Towards Best Practice in Land-based Salmonid Farming: Options for Treatment, Re-use and Disposal of Effluent. Marine and Freshwater Resources Institute, Alexandra. 121 pp.
Metzeling, L, Bibrowska, H, & Goudey, R 1993. The Impact of Fish Farming on the Goulburn River. Environment Protection Authority of Victoria Report SRS 91/011 ISBN 0 7306 2891 4.
Metzeling, L, Bibrowska, H, & Goudey, R 1996. The Effect of Fish Farming on the Water Quality and invertebrate Fauna of Two Upland Rivers. Environment Protection Authority Publication 482 .
Naylor, RS, Goldburg, RJ, Primavera, JH, Kautsky, N, Beveridge, MCM, Clay, J, Folke, C, Lubchenco, J, Mooney, H, and Troell, M 2000. Effect of Aquaculture on World Fish Supplies. Nature. 405: 1017-1024.
NCC 1990. Fish Farming and the Scottish Environment. NCC Contract No. HF3-03 450. Nature Conservancy Council.
NRC 1993. Nutrient Requirements of Fish. Natural Research Council, National Academy Press, Washington, DC, 114pp.
ORR 1999. Final Report: Office of Regulatory Reform Task Force Review of Regulatory Arrangements in the Victorian Aquaculture Industry. Office of Regulatory Reform, Melbourne. 55 pp.
Piferrer, F 2001. Endocrine sex control strategies for the feminisation of teleost fish. Aquaculture, 197 (2001), 229-281.
Puglisi, D (1991). (Ed.) Options for utilisation of fish Aprocessing wastes. New York Sea Grant Communications. March 1991.
Seafood Services Australia 2002. The Seafood EMS Chooser. Published by Seafood Services Australia Hamilton Qld.
Shepherd, C.J, and Bromage, NR (Eds) 1988. Intensive Fish Farming BSP Professional Books, Great Britain 404pp.
Summerfelt, ST 2002. Understanding and treating carbon dioxide problems. Aquaculture Magazine. Volume 28, Number 4, p 30-33.
Tacon, AGJ 1993. Feed Formulation and On-Farm Feed Management. In: New, MB, Tacon, AGJ. and Csavas, I (1993) eds. Farm-Made Aquafeeds. Proceedings of the FAO/AADCP Regional Expert Consultation on Farm Made Aquafeeds, 14.18 December 1992, Bangkok, Thailand. FAO-RAPA/AADCP, Bangkok, Thailand, 434 pp.
Victorian Government Gazette 2003. Variation to State Environment Protection Policy (Waters of Victoria). No. S 107, Wednesday 4 June, 2003.
VTA 1998. Industry Code of Practice. Victorian Trout Association. Alexandra, Victoria.
Warrer.Hansen, I 2002. The Importance of Oxygen. Trout News. Issue No. 34, pp 13-15. July 2002.
Appendix 1: Guidelines for water quality parameters in aquaculture production
Physico-chemical stressor and toxicant guidelines for the protection of aquaculture species (from ANZECC, 2002).
| Measured parameter | Recommended Guideline (mg/L) | |
|---|---|---|
| Freshwater production | Saltwater production | |
| Alkalinity | ≥20 | >20 |
| Biochemical oxygen demand | <15 | ND |
| COD | <40 | ND |
| Carbon dioxide | <10 | <15 |
| Colour and appearance of water | 30-40 (Pt-Co units) | 30-40 (Pt-Co units) |
| Dissolved oxygen | >5 | >5 |
| Gas supersaturation | <100% | <100% |
| pH | 5.0-9.0 | 6.0-9.0 |
| Suspended solids (and turbidity) | <40 | <10 (<75 Brackish) |
| Temperature | <2.0°C change over 1 hour | <2.0°C change over 1 hour |
| Salinity (total dissolved solids) | <3000 |
3300-37 000) (3000-35 000 Brackish) |
| INORGANIC TOXICANTS (HEAVY METALS ND OTHERS) (µg/L) | ||
| Aluminium | <30 (pH>6.5) <10 (pH <6.5) | <10 |
| Ammonia (un-ionised) | <20 (pH>8.0) coldwater <30 warmwater | <100 |
| Arsenic | <50 | <30 |
| Cadmium (varies with hardness) | <0.2-0.18 | <0.5-5 |
| Chlorine | <3 | <3 |
| Chromium | <20 | <20 |
| Copper (varies with hardness) | <5 | <5 |
| Cyanide | <5 | <5 |
| Fluoride | <20 | ND |
| Hydrogen sulfide | <1 | <2 |
| Iron | <10 | <10 |
| Lead (varies with hardness) | <1-7 | <1-7 |
| Magnesium | <15 000 | ND |
| Manganese | <10 | <10 |
| Mercury | <1 | <1 |
| Nickel | <100 | <100 |
| Nitrate (NO3-) | <50 000 | <100 000 |
| Nitrite (NO2) | <100 | <100 |
| Phosphates | <100 | <50 |
| Selenium | <10 | <10 |
| Silver | <3 | <3 |
| Tributyltin (TBT) | <0.026 | <0.01 |
| Total ammonia nitrogen (TAN) | <1000 | <1000 |
| Vanadium | <100 | <100 |
| Zinc | <5 | <5 |
| ORGANIC CHEMICALS (NON-PESTICIDES) | ||
| Detergents and surfactants | <0.1 | ND |
| Methane | <65 000 | <65 000 |
| Oils and greases (including petrochemicals) | <300 | ND |
| Phenols and chlorinated phenols | <0.6-1.7 | ND |
| Polychlorinated bi phenyls (PCBs) | <2 | <2 |
| Measured parameter | Guideline (mg/L) | |
| Freshwater production | Saltwater production | |
| PESTICIDES | ||
| 2,4-dichlorophenol | <4.0 | ND |
| Aldrin | <0.01 | ND |
| Azinphos-methyl | <0.01 | ND |
| Chlordane | <0.01 | 0.004 |
| Chlorpyrifos | <0.001 | ND |
| DDT(including DDD & DDE) | <0.0015 | ND |
| Demton | <0.01 | ND |
| Dieldrin | <0.005 | ND |
| Endosulfan | <0.003 | 0.001 |
| Endrin | <0.002 | ND |
| Gunthion (see also Azinphos-methyl) | <0.01 | ND |
| Hexachlorobenzole | <0.00001 | ND |
| Heptachlor | <0.005 | ND |
| Lindane | <0.01 | 0.004 |
| Malathion | <0.1 | ND |
| Methoxychlor | <0.03 | ND |
| Mirex | <0.001 | ND |
| Paraquat | ND | <0.01 |
| Parathion | <0.04 | ND |
| Toxaphene | <0.002 | ND |
ND: Not determined
Appendix 2: SEPP water quality objectives for rivers and streams
Appendix 3: Environmental issues during site selection,farm design and construction
New entrants to the salmonid aquaculture industry have an opportunity to address many potential environmental issues prior to development through appropriate site selection and farm design.
Site selection and farm design
It is in the interests of aquaculture companies to ensure a clean, safe environment near their farm (Cripps, 1994). In aquaculture there is a clear relationship between the physical and biological attributes of sites and the economic and environmental costs of developing a project. Surveys prior to the establishment of a new fish farm, or expansions of an existing farm, should examine environmental, economic and operational considerations with particular attention given to the issues identified in Table I.
Ideally, a consultation process with the following groups should be coordinated prior to the commencement of any development:
- government agencies (i.e. The Victorian Fisheries Authority, DSE and EPA);
- local authorities (i.e. local government, RWA and CMA);
- local residents;
- other fish farmers on the river; and
- interest groups (e.g. angling clubs, land care groups, etc.).
Effective communication with local groups will help to avoid or resolve conflicts and obtain local information that may assist in planning the development. Early consultation with the EPA is important as existing nutrient levels in some waterways, or nutrient limits imposed on a catchment, may prohibit or severely restrict the size and type of fish farm on a particular waterway.
New and expanding farms should undertake a comprehensive environmental impact assessment to evaluate the feasibility of works and potential environmental impacts. Environmental impact criteria governing site selection of a new fish farm should be sufficiently flexible to allow for site specific requirements as not all potential impacts will be applicable to all sites.
Farm design
During the design phase, operators have an opportunity to address site-specific environmental issues by customising their farm layout and infrastructure. Some of the issues that can be addressed during farm design are listed in Table II.
New entrants to the industry also have the opportunity to design their system to reduce the production of wastes and optimise waste management and treatment. This can be achieved through an .integrated waste management system.' The design of each component in such a system will condition the water so it is in a suitable form for handling or use at the next stage.
Components of an integrated waste management system may include:
- feeding systems;
- pond or raceway design;
- solids separation units;
- solids or nutrient treatment units;
- sludge treatment; and
- waste solids or nutrient re-use or disposal facilities.
Table I: Issues to be considered when selecting a site for salmonid aquaculture
| Issues | |
|---|---|
| Land topography |
|
| Geology and soils |
|
| Access to water |
|
| Water quality and pollution |
|
| Location |
|
| Infrastructure |
|
This information can be used to select an appropriate wastewater treatment strategy. For consistent waste treatment, the system itself should comprise:
- the rapid separation of particles from the primary flow;
- simple indicators of non-functioning or non- optimal levels of treatment;
- the minimisation (preferably removal) of soluble components;
- an adaptable system to meet the full range of conditions that may be encountered;
- multi-phase treatment; and
- parallel, back-up treatment systems to allow for any system malfunction and off-line maintenance.
Table II: Issues to be considered when designing a salmonid farm
| Issues | BPEM |
|---|---|
| Design of water abstraction and discharge structures |
|
| Water use efficiency |
|
| Water treatment |
|
| Sludge disposal |
|
| Disposal of mortalities and processing wastes |
|
| Visual impacts |
|
| Escapes |
|
| Energy efficiency |
|
Farm construction
Farm construction should be carried out according to best practice standards and Table III summarises some of the major issues that should be addressed.
Table III: Issues to be considered during construction
| Issues | BPEM |
|---|---|
| In- stream works |
|
| Downstream works |
|
Appendix 4: Acronyms and abbreviation.
| APVMA | Australian Pesticides and Veterinary Medicines Authority |
| BOD or COD | Biochemical or Chemical Oxygen Demand |
| BPEMG | Best Practice Environmental Management Guidelines |
| CMA | Catchment Management Authority |
| DNRE | Department of Natural Resources and Environment (Vic) |
| DO | Dissolved Oxygen |
| DPI | Department of Primary Industries (Vic) |
| DSE | Department of Sustainability and Environment (Vic) |
| EIP | Environmental Improvement Plans |
| EMS | Environmental Management System |
| EPA | Environmental Protection Authority (Vic) |
| FCR | Food Conversion Ratio |
| FV | The Victorian Fisheries Authority |
| MAFRI | Marine and Freshwater Resources Institute |
| NATA | National Association of Testing Authorities |
| OH&S | Occupational Health and Safety |
| PIRVic | Primary Industries Research Victoria |
| RWA | Rural Water Authority |
| SEPP | State Environment Protection Policies |
| SS | Suspended Solids |
| TN | Total Nitrogen |
| TP | Total Phosphorous |
| VTA | Victorian Trout Association |