Total Allowable Commercial Catch
Rock Lobster Fishery Harvest Strategy
(excerpt from the Victorian Rock Lobster Fishery Management Plan 2024)
Harvest strategies provide a structured framework for assessing the status of a fishery and a set of rules to determine the annual catch limits. Decisions regarding catch limits are therefore set out in advance, ensuring that fishers, fishery managers and other relevant stakeholders know what action will be taken in response to the conditions in the fishery (Sloane et al 2014).
Unlike the previous harvest strategy that focused on setting a constant exploitative rate to enable stock rebuilding, the foundation of this harvest strategy is based on establishing a clear rebuilding target to be achieved within a defined time frame. As the stock rebuilds, more conservative exploitation rates will be adopted to increase the resilience of the fishery.
Operational objectives
The harvest strategy aims to achieves three main operational objectives, all of which link to the overarching objectives for the management of the fishery. These operational objectives are:
1. Establish a clear target that guides rebuilding trajectories of the rock lobster population by setting appropriately conservative TACCs on an annual basis.
2. Ensure the agreed Target Reference Point (TRP) of 28 percent and 28.8 percent pre-fishing available biomass for the Western Zone and Eastern Zone, respectively, is reached by 2043.
3. As the stock rebuilds, gradually transition towards a more conservative exploitation rate to reduce the probability of future declines back to the current level.
Principles of the harvest strategy
- The harvest strategy is based on standardised CPUE from commercial catch and effort logbook information and is derived from the ‘fishing year data series’ (i.e. November to September). All estimates of standardised CPUE are rounded to two decimal places.
- TACCs are set by assessing the fishing zone’s performance against stock performance indicators, biological reference points and applying decision rules. These factors include the standardised CPUE from that year’s stock assessment, a pre-recruit index (PRI) and predefined TACC tables that determine whether the annual TACC is increased, maintained or decreased in the following season.
- TACCs are predetermined and have been calculated to ensure that the target reference points are achieved within the rebuilding timeframe.
- The exploitation rate is zero at or below the CPUE limit reference point.
- The TACC is calculated in each CPUE band on the basis of the exploitation rate in that band. The TACC is capped at a specified level, consequently the exploitation rate declines once this cap is reached.
- The fishery will be closed to all fishing if the annual standardised CPUE falls below 0.30kg/pot lift for the Western Zone and 0.25kg/pot lift for the Eastern Zone (the lower limit reference point)
- To receive an increase in TACC, the annual PRI must be above the PRI threshold set for each zone. * The TACC can only be increased by one level at any time (‘one-jump rule’).
- An upper limit, or cap, on TACC levels has been included in this harvest strategy. The cap is 245 tonnes for the Western Zone and 32 tonnes for the Eastern Zone.
Stock performance indicators
Performance indicators measure and track the performance of the stock against the operational objectives in this harvest strategy and are integral in determining the level at which the TACC will be set.
Three biological performance indicators are used in setting the TACC:
- Egg production – an estimate of the reproductive potential of the population. It is a crucial determinant of the health of the stock and is used in this strategy as a primary indicator in the decision rules.
- Standardised CPUE – CPUE data comes from the catch and effort logbooks submitted by commercial fishers. It is expressed as the catch (kilograms) achieved per pot lift. In lobster fisheries, CPUE closely correlated to abundance and is widely accepted as being a proxy for abundance of legal-size rock lobsters. Standardised CPUE is calculated from logbook data that has undergone a quality control process and has been standardised for a range of factors that affect catchability, such as month, year, depth, region and fisher (i.e. the ability and practices of fishers).
- Pre-recruit index – is the number of undersize lobsters per pot lift and is derived from the data collected through the fixed-site survey and on-board observer programs. This provides a measure of the level of recruitment to the legal-size biomass likely to be experienced in the next few years.
The total biomass (for all lobsters >60mm) is also available from the stock assessment model and is used as an additional performance indicator in the assessment of the fishery. This indicator does not directly impact TACC adjustments but is used as a secondary indicator to track the stock status and performance against the rebuilding trajectory.
Reference points for the performance indicators
Reference points are the benchmarks of performance that define acceptable levels of impact on a stock. Reference points are usually linked to the performance indicators and three types have been used; these are limit, threshold and target reference points.
Limit reference points
A limit reference point (LRP) provides a level below which the risk to the stock is unacceptably high and severe management action is required. For this fishery egg production compared to the pre-fishing stock is the indicator used to assess performance against the LRP.
The LRP is set to 20 percent of the unfished level of egg production. Due to the high potential consequence of falling below the LRP, a 90 percent probability of the fishery being above the LRP is required. Work in other crustacean fisheries indicates that generally these fisheries are resilient to exploitation and 20 percent is a conservative LRP.
As the LRP is also used in formulating the CPUE-TACC table, a CPUE proxy for LRP is also required. This proxy can also be used when model-based egg production estimates are unavailable. Based on analysis of past egg production estimates and CPUE, the LRP CPUE is 0.30kg/pot lift for the Western Zone and 0.25kg/pot lift for the Eastern Zone.
Threshold reference point
Threshold reference points can represent a threshold value which triggers a certain management action or a pre-determined management response.In this harvest strategy, threshold reference points have been established for the PRI. These thresholds are set at the 40th percentile of a normal distribution fitted to the PRI during a reference period of 2008 to 2022.
To be eligible for an increase in the TACC in an upcoming season, the PRI for that stock assessment period must be above the threshold level for that zone.
The PRI thresholds are:
- 1.67 undersize per pot lift in the Western Zone; and
- 0.25 undersize per pot lift in the Eastern Zone.
Target reference point
A target reference point (TRP) provides an indication of the level around which the fishery should be managed to best achieve its biological, social and economic objectives. For this fishery total biomass above 60mm carapace length, as compared to the pre-fishing stock, is used as the indicator to assess performance against the TRP. This is defined as 40 percent of the biomass that would be available if fishing stopped.
Despite the above, research has identified that a substantial reduction in productivity across the Australian Southern Rock Lobster stock is likely due to an environmentally driven regime shift. Analysis indicates that if fishing was to permanently cease, biomass is only expected to return to 70 percent and 72 percent of the pre-fishing level in the Western Zone and Eastern Zone respectively. Consequently, the TRP has been set at 28 percent and 28.8 percent for the Western Zone and Eastern Zone respectively.
Decision rules to set the TACC
The TACC is set using a CPUE-TACC table in conjunction with a harvest control rule. The harvest control rule (HCR) regulates the rate at which the TACC can increase and decrease in response to CPUE changes. The HCR also implements the shift to more conservative exploitation rates over time and draws on the secondary PRI indicator to prevent TACC increases when undersize abundance is low. The HCR is divided into two decision rules:
Decision Rule 1: Egg production
Model estimated egg production must be above the limit reference point of 20% of the unfished level with a 90% probability. This decision rule must be satisfied before the CPUE-based harvest strategy can be used to set the TACC.
If this decision rule is not met, the TACC will be determined using the rock lobster fishery model to ensure that the TACC returns the egg production to above the limit reference point within two years with a 90% probability.
Decision Rule 2: TACC Determination
When Decision Rule #1 has been met, the TACC is set using the standardised CPUE tables. Refer to Tables 1 and 2, for the Western and Eastern Zones, respectively.
- The fishery will move to the next CPUE band (and possibly a higher TACC unless the cap has been reached) if:
- the standardised CPUE is in a band higher than in the previous season;
AND
- the PRI (rounded to two decimal places) is at or above the threshold level of 1.67 undersize per pot lift for the Western Zone or 0.25 undersize per pot lift for the Eastern Zone.
Note that the CPUE band can only increase a single level per year. If the new CPUE band has reached the final value for that step, as indicated by the arrow, then the next step will be used for setting this TACC and the TACC in all subsequent years.
- The TACC will remain at the same level and the same band when:
- the standardised CPUE remains in the current band;
OR
- the standardised CPUE has increased to a higher band but the PRI is below the trigger point.
- The TACC will be decreased when:
- the standardised CPUE has decreased into any lower band. In this circumstance the TACC will be set at the level that corresponds to the standardised CPUE band in the current step.
- The harvest control rule will be reviewed when:
- The catch rate band decreases for two consecutive years; or
- The PRI is below threshold for two consecutive years.
TACC Tables
The harvest control rule sets a TACC that implements an exploitation rate which starts at zero at the LRP and then increases linearly to a maximum level as biomass increases. The TACC is also capped, hence once biomass exceeds the level at which the TACC cap is reached the exploitation rate decreases (Figure 1). A key principle underlying this harvest strategy is that as the stock rebuilds, more conservative exploitation rates will be adopted. This ensures that the risk of future stock declines is significantly reduced.
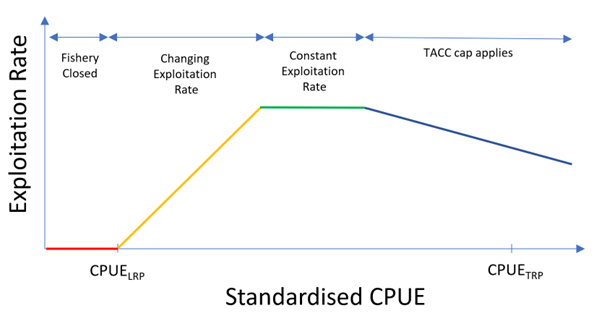
Figure 1: Conceptual relationship between exploitation rate and the stock status indicator (standardised CPUE). The exploitation rate rises from 0 at the CPUE LRP proxy to its maximum value. It then remains at this maximum value until the TACC cap is reached after which it declines. This decline is because no further TACC increases are permitted but the stock continues to increase.
The exploitation rate is implemented through a relationship between CPUE and the TACC. Tables 1 and 2 show the highest TACCs that can be set for each CPUE band in order to achieve the TRP within the rebuilding time frame. More details of how this is operationalized in practice are provided in the commercial harvest control rule section.
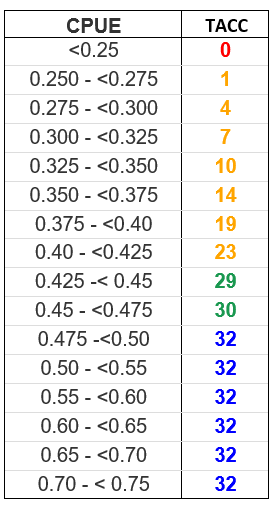
Table 1: The highest TACC (t) that can be set in the Western Zone and still achieve a rebuild to the TRP within the rebuilding time frame. The TACC depends on the stock state as indicated by the standardized CPUE. A recreational catch of 6t has been assumed. Red indicates when the fishery is closed, orange where the exploitation rate is increasing, green a constant exploitation rate and blue a capped TACC.
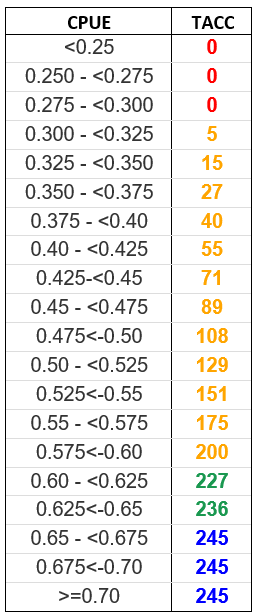
Table 2: The highest TACC (t) that can be set in the Eastern Zone and still achieve a rebuild to the TRP within the rebuilding time frame. The TACC depends on the stock state as indicated by the standardized CPUE. A recreational catch of 6t has been assumed. Red indicates when the fishery is closed, orange where the exploitation rate is increasing, green a constant exploitation rate and blue a capped TACC.