Evaluation of effects of targeting breeding elephant fish by recreational fishers in Western Port

December 2008
J. Matias Braccini, Terence I. Walker and Simon Conron
Preferred way to cite this publication:Braccini, J. M., Walker, T. I., Conron, S. D. (2008). Evaluation of effects of targeting breeding elephant fish by recreational fishers in Western Port. Draft Final report to Fisheries Revenue Allocation Committee. (December 2008.) 59 + ii pp. (Fisheries Research Brand: Queenscliff, Victoria, Australia).
ISSN: 1449-2520
ISBN: 1 74146 935
Table of Contents
Executive Summary
Introduction
Methods
Recreational fishing catch
Trends in abundance and length-frequency composition of the catch
Improved estimates of total catch and effort
Reproduction and ageing
Habitat requirements
Alternative harvesting strategies
Results
Recreational fishing catch
Trends in abundance and length-frequency composition of the catch
Discarding
Improved estimates of total catch and effort
Reproduction and ageing
Habitat requirements
Alternative harvesting strategies
Discussion
Recreational fishing catch
Trends in abundance and length-frequency composition of the catch
Improved estimates of total catch and effort
Reproduction andageing
Habitat requirements
Alternative harvesting strategies
Conclusions
Acknowledgements
References
Executive Summary
Over the past decade, there has been a rapid increase in the targeting of aggregations of elephant fish (Callorhinchus milii) moving into Western Port during February–May. Prior to the present study, preliminary estimates indicated that the annual recreational catch in Western Port is of the order of 22,000 fish or 66 tonnes, similar to the entire commercial annual catch from the whole of south-eastern Australia. This created a need to assess the impact of this catch on the stocks and future catches, and to inform management of the potential need for a response to ensure sustainable stocks.
Available datasets were summarised. The charter boat and creel surveys run in Western Port showed contrasting trends in annual CPUE. For the charter boat survey, a decline in CPUE was observed from 1998 to 2008, suggesting a decline in relative abundance. For the creel surveys (MAFFRI Ongoing Creel Survey and 2008 February–May Survey), however, no clear trends in CPUE were observed. The apparent stable trend in annual CPUE should be interpreted with caution if using this information to infer trends in abundance of the elephant fish stock in Bass Strait. Assuming new individuals continue to migrate into Western Port to its carrying capacity every year, if the elephant fish stock abundance outside Western Port declined, this decline would not be immediately observed when analysing CPUE trends for Western Port.
A bus-route and charter boat surveys were conducted to determine the total harvest (retained fish only) of elephant fish in Western Port for 2008. The elephant fish total harvest (with standard error) was estimated at 13,931 (±798) fish or 45 (±3) tonnes. Of this catch, most fish were mature females. This previously source of unaccounted fishing mortality, particularly mortality of mostly breeding females, can have a large impact on the sustainability of the stock by reducing recruitment. Alternative harvest strategies were evaluated by producing future projections of alternative fixed fishing effort levels and fixed gear mix. The annual total commercial catch of 69 tonnes from Bass Strait during 1995–06 together with the estimated annual harvest of 45 tonnes from the recreational fishery in Western Port during 2008 gives a total annual catch of 114 tonnes. This is similar to the estimated maximum sustainable yield for the entire stock of elephant fish in Bass Strait and Victoria's bays and inlets. Given the statistical uncertainty associated with the estimated maximum sustainable yield, the uncertainty associated with the estimated harvest from the recreational fishery in Western Port, and the uncertainty associated with the post-capture mortality of discarded elephant fish, there is a high risk of the current harvest levels being not sustainable. Further monitoring in Western Port would improve the recreational fishing total harvest estimates to better determine the sustainability of the elephant fish stock and provide an indication of the success of any management measures adopted. Choices for reducing the catch to avoid risk of stock depletion include cutting the total allowable catch for the commercial offshore fisheries in Bass Strait and reduced bag limits, closed seasons, and closed areas in Victoria's recreational fishery.
Introduction
The elephant fish (Callorhinchus milii) is an oviparous holocephalan (related to sharks and rays) distributed from Esperance in Western Australia to Sydney in New South Wales, including Tasmania, at depths to at least 200 m, but the main concentrations are in Bass Strait. Elephant fish also occur in New Zealand, but are assumed to be a separate stock from the population in southern Australia (Last & Stevens 1994).
The stocks of southern Australia are impacted mostly by a Victorian hook and line recreational fishery targeting elephant fish in Western Port and by several fishing methods in the Commonwealth managed Southern and Eastern Scalefish and Shark Fishery. In Victoria, recreational fishers have been targeting aggregations of breeding elephant fish moving into Western Port and, to a lesser extent, Port Phillip Bay and the Barwon River Estuary for at least a decade. Breeding fish enter these bays and estuary to lay eggs during February–May in specialized nursery areas of soft sediments. Western Port is recognised as the most important nursery area for elephant fish in south-eastern Australia. Targeting breeding aggregations can markedly reduce recruitment, particularly for species like elephant fish that produce only a small number of young and have strong stock-recruitment relationships. The elephant fish, like other holocephalans and their relatives the sharks and rays, have particularly low reproductive rates making them highly susceptible to overfishing.
The elephant fish is also taken as byproduct in the Gillnet Hook and Trap Fishery of southern Australia. Commercial catches are taken mostly in Bass Strait and off the eastern and south-eastern coast of Tasmania. Small quantities are taken by demersal otter trawl and Danish seine off eastern Victoria and by demersal otter trawl off eastern South Australia (Walker & Gason 2007). The closure of all Victorian ocean waters to shark gillnet fishing (since 1988), a legal minimum gillnet mesh-size of 6 inches (since 1975) and a legal maximum mesh-size of 6½ inches (since 2000) facilitate escapement from gillnets by small pre-recruit and large breeding elephant fish in Bass Strait. These management arrangements ensured that the commercial catches and the stocks had been sustainable since 1970 when the shark gillnet fishery began landing elephant fish from Bass Strait. However, recent assessments indicate that the Bass Strait elephant fish stocks are in decline, which is surprising because gillnet fishing effort in this region has been markedly reduced (Punt et al. 2004). The stock decline could be related to an increase in mortality experienced by elephant fish during their annual reproductive migration into Victorian bays and inlets, to a decline in recruitment as a result of the mortality of the breeding fish, to habitat degradation, or to a combination of these.
The elephant fish is highly susceptible to the effects of fishing due to its low reproductive rate and longevity (~20 years). In recent years, anglers targeting elephant fish have showed a preference for retaining the large females over the smaller males and there is concern that excessive mortality of the breeding female fish may threaten the sustainability of this fishery in the long term.
Habitat degradation may also have affected the elephant fish stocks. Habitat degradation impact on species of low biological productivity, like the elephant fish, is more likely to result in a major reduction in adult stock size or recruitment failure than it would for teleost or invertebrate species (Walker & Hudson 2005). In Western Port, fishing mortality during breeding aggregations is high, and habitat degradation has occurred through dredging of channels, loss of seagrass beds and mangroves, and high nutrient loading.
There are obligations under Australia's National Plan of Action for the Conservation and Management of Sharks (NPOA-Sharks) on resource users and Governments to ensure that the elephant fish stocks are harvested sustainably and rationally and that there is a full evaluation of catches by each user group. Commercial catches have been evaluated, but recreational catches are yet to be accurately evaluated.
The present study evaluates the recreational fishing catch of elephant fish in Western Port to identify any risks that may impact on the sustainability of the resource and to inform management of the potential need to respond to the effects of fishing. To make this evaluation, it is necessary to develop and apply an appropriate fishery population dynamic model that takes account of both the recreational fishery and the commercial fishery of Bass Strait. This study also identifies the habit characteristics of the current elephant fish breeding grounds in Western Port.
There were seven main objectives to this project:
- Provision of inter-annual abundance trends for elephant fish in Western Port through thorough analysis of available recreational fishing data sets.
- Provision of more accurate estimates of elephant fish catch and effort, and seasonal trends in catch and effort from recreational fishing by increasing sampling intensity of the routine creel monitoring during February–May of 2008 in Western Port.
- Provision of advice on appropriate sampling regimes (including a tagging program to be undertaken by VicTag) to improve abundance indices and catch estimates for elephant fish from Victoria's ongoing recreational fishing monitoring programs.
- Determination of seasonal length-frequency and age-frequency profiles of elephant fish caught in Western Port by the recreational fishing sector.
- Determination of relationship between number of eggs laid annually and length/age of elephant fish, and length/age-at-maturity in Western Port.
- Preparation of a detailed seabed survey showing the distribution and habitat characteristics at three breeding areas and their surrounds.
- Evaluation of the effects of alternative harvesting strategies ranging from no controls to a selected mix of bag limits and area closures on the sustainability of stocks and catches, through the application of simple models to explicitly estimate the potential impact of recreational fishing on egg production.
Methods
Recreational fishing catch
Several approaches were used to determine the recreational fishing catch of elephant fish in Western Port. Total catch and effort, catch rates (used as a proxy for abundance), length-frequency composition of the catch and temporal abundance patterns of elephant fish were obtained from several data sources for the period February-May, when the elephant fish migrates into Western Port to lay eggs.
Trends in abundance and length-frequency composition of the catch
Available recreational fishing monitoring data sets were identified and summarised to determine inter-annual abundance trends and length-frequency composition of the elephant fish catch in Western Port. Data sets comprised a Marine and Freshwater Fisheries Research Institute (MAFFRI) on-going creel survey designed to collect time series of catch rates and catch composition of elephant fish and other key recreational species for 1998–07, and a MAFFRI charter boat survey conducted between 1998 and 2001 that was aimed at complementing the creel survey.
For the MAFFRI Ongoing Creel Survey, a survey agent followed a stratified random sampling design moving around boat ramps in a pre-determined direction counting the number of anglers and boat trailers, and interviewing fishing parties encountered (Ryan et al. 2007). Only avid anglers were interviewed as data from only this group is assumed to be a reliable indicator of relative abundance. The catch of each interviewed fishing party was identified, measured and counted, and the fishing effort was recorded as the number of anglers and time spent fishing.
For the charter boat survey, selected charter boat operators were asked to fill out a fishing logbook where they recorded the total catch, fishing time, fish measurements, and number of anglers for each fishing trip.
The anglers' practice of targeting aggregations of elephant fish can lead to hyperstable catch rates where the catch rate remains high despite a decline in the stock abundance (Hilborn & Walters 1992). To address the possibility of hyperstability effects in catch rates, several methods were trialled: raw data, the habitat ratio weighing method (i.e. catch rate weighted by the number of cells where fishing occurred), the non-zero catch method (i.e. a calculation of the catch rate excluding 0 catches), and a calculation of catch rate excluding the area cells with highest catch rates (considered catch hot spots) across years (D4 and D5 from Figure A1.3). Unit of effort was defined as angler-hour and catch rate was defined as the catch of both retained and discarded fish per unit of effort (CPUE). Harvest rate (catch of retained fish only per unit of effort, HPUE) is not used in this study because it is not a reliable index or relative abundance due to the anglers high-grading practice of only keeping large fish and discarding small fish given bag limit regulations. There are several ways in which catch rates can be calculated. For the present study, we used the mean daily estimator as it is one of the most precise methods (Crone & Malvestuto 1991). The primary sampling unit for determining mean daily catch rate was survey day. Bootstrapping was used to estimate 95% confidence intervals (2.5th and 97.5th percentiles) around catch rate estimates.
The data sets used for the trends-in-abundance analysis do not provide an estimate of total fishing effort; i.e., total catch cannot be estimated by multiplying catch rates by total effort. Therefore, a different approach was adopted for estimating total catch and total effort for 2008.
Improved estimates of total catch and effort
A literature review was conducted to determine an accurate and cost-effective method for estimating recreational fishing total catch, total effort and catch rates for elephant fish from Victoria's on-going recreational fishing monitoring programs. A bus-route survey (hereafter named as the "2008 February–May Survey") was the preferred method for a detailed quantification of the 2008 total catch, total effort, and catch rates of elephant fish for a large area such as Western Port with defined access points. A charter boat survey and questionnaire were also conducted to monitor charter boats total catch and effort and to obtain a profile of the sex, length and age composition of the catch. For a detailed description of the adopted experimental design refer to Appendix 1.
To determine the most cost-effective sampling intensity for the 2008 February–May Survey, different combinations of survey day were tested from 10% (i.e. 6 week days and 3 weekend days) to 100% (i.e. 63 week days and 28 weekend days) fishing day coverage in steps of 25% increase coverage during the elephant fish season using the bootstrap method.
Reproduction and ageing
As part of the 2008 February–May Survey, on-board observers collected biological samples during several charter boat trips. At sea, elephant fish were measured, sexed and dissected to determine their reproductive condition. Reproductive condition was determined following Walker (2005). To determine reproductive condition in males, clasper calcification (CI), testis (GI), seminal vesicle (VI) condition, and seminal fluid fullness (VF) were recorded. To determine reproductive condition in females, ovaries (GI) and uterus (UI) condition and diameter of the largest ovarian follicle were recorded. Logistic models were used to determine the proportion of mature males and females at any length. Also for females, the number of yolky follicles was counted for each ovary to determine the relationship between the numbers of eggs laid annually and body length.
Dorsal fin spines were also collected onboard charter boats for age determination. Soft tissue was removed by trimming off the skin, flesh, and cartilage with a scalpel. Some spines were discarded as they were worn below the top of the pulp cavity and could not be used for age determination. Spines were air dried and embedded in epoxy resin and sectioned with a GemmastaTM lapidary saw with a diamond-impregnated blade. Cross-sections (~250 µm) were cleaned using ethanol and water, air-dried and mounted on glass slides using epoxy resin. The inner dentine layer showed the clearest banding pattern and hence was used for counting growth-increment bands. Maximum count of bands in the inner layer was found at the apex of the pulp cavity, representing the optimal position of sectioning. Following Sullivan (1977), the average width at the optimal point of section was calculated by serially sectioning 27 spines and averaging the width at which each showed the clearest and most numerous increments. The average width (= 1.3 mm) was then marked on the rest of the spines using digital Vernier callipers and, for each spine, five or six sections were taken from this region. The sections were examined under transmitted light using a Leica IM 4.0 digital image system on a Leica DMLB compound microscope. Ages were estimated by counting the number of complete zones (translucent – opaque sequence). The total age was calculated as the total number of increments minus one to adjust for the birth mark. A subjective readability score was assigned to each spine. All spines were read by a single reader (first reader) and a second reader read a random sub-sample of 50 spines for evaluation of between-reader precision. For this, the Average Percentage Error Index (APEI) was calculated. Finally, an age key was produced and was used to convert the 2008 elephantfish catch length-frequency composition to age-frequency composition.
Habitat requirements
A detailed seabed survey using side scan sonar and under water video was originally proposed as a method for showing the distribution and habitat characteristics of elephant fish breeding areas. However, the identified breeding and high-concentration areas were located in very shallow waters and narrow deep channels of high turbidity, limiting the information that could be obtained from side scan sonar and video surveying. Hence, an alternative and more cost-effective approach was adopted. Available habitat and sediment mapping information was summarised and combined with the collected elephant fish abundance information and expert advice (charter boat operator knowledge) to characterise the elephant fish catch hot spots and egg-laying areas.
Alternative harvesting strategies
A deterministic fishery stock assessment model was developed and applied to the commercial fisheries for elephant fish in Bass Strait for alternative harvest strategy evaluation. This was then used to assess the likely sustainability of current commercial catches in Bass Strait together with the recreational catch estimated from the 2008 Western Port recreational fishing survey. For a detailed description of the modelling approach refer to Appendix 2.
Results
Recreational fishing catch Trends in abundance and length-frequency composition of the catch
For the MAFFRI Ongoing Creel Survey and the 2008 February–May Survey, March and April commonly exhibited the highest values of mean CPUE throughout the surveyed period (Figure 1). Also, data were always collected during these months whereas for some years, little CPUE data were collected during February or May. Hence, CPUE data collected only during March and April were used in the annual trend analysis. For the raw data, there were no clear overall annual trends in the mean CPUE of elephant fish, with anglers catching between 0.2 and 0.6 elephant fish per angler-hour during 1998–08 (Figure 2). A similar annual pattern was observed when analyses were done using non-targeted effort (not shown). Large variation was observed in the confidence intervals for 2006 due to unusually high discarding practice occurring that year by some of the interviewed parties (Figure 8). There was a decrease in the number of fishing cells fished per year (Figure 4). The fishing cells with the highest fishing effort were D4 and D5 (Figure 5a). The other approaches used to explore the possibility of catch rate hyperstability did not show any consistent trend of increase or decrease in annual mean CPUE (Figure 2). For 2006, the year with the highest mean CPUE, the substantial difference in mean CPUE between the 'raw data' curve and the 'no D4 and D5 cells' curve showed that most of the fishing was done in these hot spots whereas for other years, the anger effort was more evenly spread (Figures 2 and 5a).
For charter boats, the mean CPUE in 1998 and 1999 was almost 1 fish per angler-hour, dropping to ~0.3 fish per angler-hour for the other years surveyed (Figure 3a). The number of fishing cells fished per year remained stable (Figure 4). As for the creel survey, the fishing cells with the highest fishing effort were D4 and D5 (Figure 5b).
The length-frequency composition of the recreational fishing harvest (creel survey) ranged from 300 to 1100 mm FL for males and from 400 to 1000 mm FL for females with a mean length of 593 ±8.9 and a mode of 530 mm FL for males and a mean length of 633 ±4.7 and a mode of 630 mm FL for females (Figure 6).
The length-frequency composition of the charter boat catch ranged from 400 to 900 mm FL for males and from 400 to 800 mm FL for females with mean length of 574 ±2.3 and a mode of 560 mm FL for males and a mean length of 699 ±1.9 and a mode of 680 mm FL for females (Figure 7).
Discarding
For any given year, ~80% of the elephant fish caught by anglers interviewed during the creel survey were retained with the exception of 2006 when 70% of the elephant fish catch was discarded (Figure 8). Monthly patterns of retained and discarded fish were generally consistent across years, reflecting the overall annual trend where most fish were retained during each month, with the exception of 2006 when most fish were discarded during March and April (Figure 9).
For charter boats, elephant fish were also mostly retained with the retained percentage ranging from 67% for 1999 to 97% for 2008 (Figure 10). As for the creel survey data, the charter boat monthly patterns of retained and discarded fish were generally consistent across years, reflecting the overall annual trend where most fish were retained during each month surveyed (Figure 11). For the 2008 charter boat survey, the retained and discarded ratio could be broken down by sex. Of the elephant fish retained, 71% were females, 23% were males and 6% were of unknown sex, indicating that 3 females are retained for every retained male. Of the elephant fish discarded, 2% were females, 65% were males and 33% were of unknown sex. Retained females ranged from 510 to 960 mm FL whereas the only discarded female was 240 mm FL. Retained males ranged from 450 to 750 mm FL whereas discarded males ranged from 300 to 590 mm FL.
Improved estimates of total catch and effort
A monthly trend in harvest (retained fish only) and effort was observed for the 2008 February–May Survey, but there were no monthly trends for the charter boat harvest and effort. For the 2008 February–May Survey, the targeted and non-targeted harvest and non-targeted effort peaked in March and then declined (Figure 12). Conversely, the charter boat harvest and effort remained stable during March and April (Figure 13).
The 2008 total targeted and non-targeted harvest of elephant fish estimated from the 2008 February–May Survey was 7,645 ±761 and 2,378 ±239 fish, respectively. The total charter boat harvest was 3,908 fish (2,126 fish for charter operators filling out the logbooks and 1,782 fish for those operators not filling out the logbooks and only responding to the questionnaires).
The harvest could be broken down by sex for the charter boat logbook survey only. The total charter boat harvest of female and male elephant fish was 1,511 (71% of the charter boat harvest) and 484 fish (23% of the charter boat harvest), respectively. A remaining 131 fish were of unknown sex (6% of the charter boat harvest).
The total targeted and non-targeted effort on elephant fish estimated from the 2008 February–May Survey was 18,208 ±835 and 80,684 ±3,434 party-hours, respectively. The total charter boat effort on elephant fish was 2,173 angler-trips (1,640 angler-trips for charter operators filling out the logbooks and 533 angler-trips for charter operators only responding to the questionnaires).
The bootstrap method performed to determine a cost-effective sampling intensity for the 2008 February–May Survey showed narrower confidence intervals of total catch and total effort with increasing sampling day coverage (Figure 14).
Reproduction and ageing
Of 134 females and 39 males dissected, 99% and 98% respectively were in mature condition, indicating that anglers are targeting breeding aggregations. The logistic models used to estimate the maturity curves did not converge as very few immature individual were collected. Therefore, maturity curves determined from these data would be biased. We therefore adopted the available ogives for Bass Strait (Walker & Hudson 2005).
There was no significant relationship between maternal length and the number of yolky follicles (p=0.99), suggesting no increase in fecundity with maternal length (Figure 15). The number of yolky follicles per female ranged between 5 and 40 and had with a mean of 18 ±5.
Of 245 dorsal fin spines collected, only 159 could be used for age determination due to the common angler practice of breaking the tip of the spines or due to the natural wear of the spine tip, the portion of the spine used for age determination. Between reader precision was high (mean APEI = 7%).
An age key was developed based on the individuals aged. This key was used to determine the age-frequency composition of the 2008 harvest for 2008 February–May Survey data, and catch and harvest for the charter boat data. For the 2008 February–May Survey, the age-frequency composition of the 2008 harvest ranged from 7 to 20 years for males and from 8 to 20 years for females with a mean age of 14.21 ±0.4 years and a mode of 14 years for males and a mean of 14.66 ±0.4 years and a mode of 14 years for females (Figure 16).
For the charter boat survey, the age-frequency composition of the 2008 catch ranged from 7 to 20 years for males and from 8 to 20 years for females with a mean age of 14.18 ±0.1 years and a mode of 14 years for males and a mean of 14.51 ±0.9 years and a mode of 14 years for females (Figure 17a). A similar age-frequency range was observed for retained and discarded fish, with a mean age of 14.18 ±0.1 years and a mode of 14 years for retained males and a mean of 14.51 ±0.1 years and a mode of 14 years for retained females (Figure 17b). The mean age of discarded males was 14.06 ±0.7 years and the mode was 14 years (Figure 17c)
There was no significant relationship between maternal age and the number of yolky follicles (p=0.42), suggesting no increase in fecundity with maternal age.
Habitat requirements
For both the 2008 February–May Survey and charter boat survey, the cells D4, D5 and D6 (Figure A1.3.) had the highest values of CPUE. Expert opinion was used to narrow down these grids to better defined areas (Figure 18). These areas are characterised by bare intertidal mud (silt and clay)-sand flats and bare subtidal habitats with high concentration of fine sand, silt and clay, and with medium sand in the deeper water channels. Rhyll Bank and Coronet Bay present a higher occurrence of clay sediments than the Bird Rock area (Shapiro 1975, Marsden et al. 1979). Within these areas, schools of only females are generally found in shallower areas over bare muddy sediments with little tidal and current movement where they presumably lay the eggs. Schools of males can also be caught in the shallows although it is very rare (Bell personal communication). Males and females are commonly caught together in channels and more tidal areas of deeper water (Gray, personal communication).
Preliminary information on the egg-laying grounds was recorded through SCUBA diving. A high concentration of eggs was found in the outer margins of subtidal areas on sandy sediments with patches of the seagrass Halophila australis along the Rhyll Bank (Gillis and Bell, unpublished). This area had little current and tidal movement and it was located between large coastal intertidal beds of the seagrasses Zostera muelleri and Heterozostera tasmanica and bare mud-sand flats (Blake & Ball 2001). No eggs were found on the intertidal Z. muelleri and H. tasmanica beds whereas the deeper mud-sand flats could not be explored due to poor visibility (Gillis and Bell, unpublished). The patches of H. australis occur next to the muddy-sandy grounds where elephant fish concentrate in highest numbers. It is possible that the bulk of the eggs are laid on these soft sediment areas where eggs become buried and are very difficult to find by SCUBA diving.
Alternative harvesting strategies
The stock assessment model estimated the initial biomass of elephant fish at 739 tonnes. Point estimates of maximum sustainable yield and the biomass required to sustain these catches varied 98–125 tonnes and 373– 413 tonnes, respectively, depending on mesh-size of gillnets or non-selective gear such as demersal trawl, longlines deployed in the Bass Strait fisheries. The average annual commercial catch of 81 tonnes during 1973–94 and of 52 tonnes from the shark fishery in Bass Strait, 12 tonnes from the trawl fishery in Bass Strait, and 5 tonnes from Victoria's bays and inlets during 1995–06 are sustainable. However, this annual commercial catch from Bass Strait together with the estimated 45 tonnes annual recreational harvest from Western Port during 2008 gives a total of 114 tonnes; a value similar to the estimated maximum sustainable yield. For a detailed description of the modelling results refer to Appendix 2.
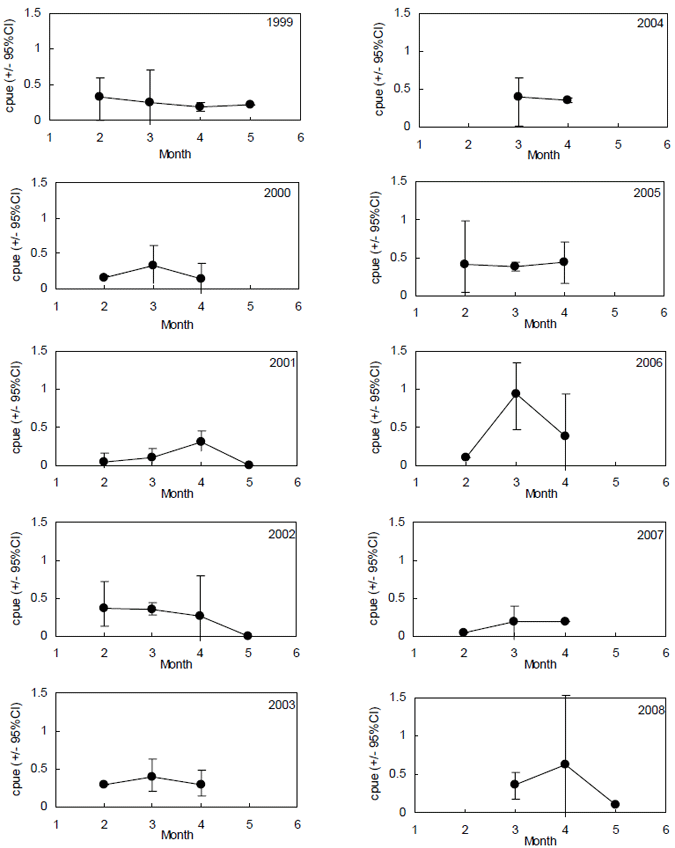
Figure 1. Monthly trends in elephant fish targeted mean daily CPUE (number of fish / angler hour) for each year surveyed in MAFFRI Ongoing Creel Survey and 2008 February–May Survey.
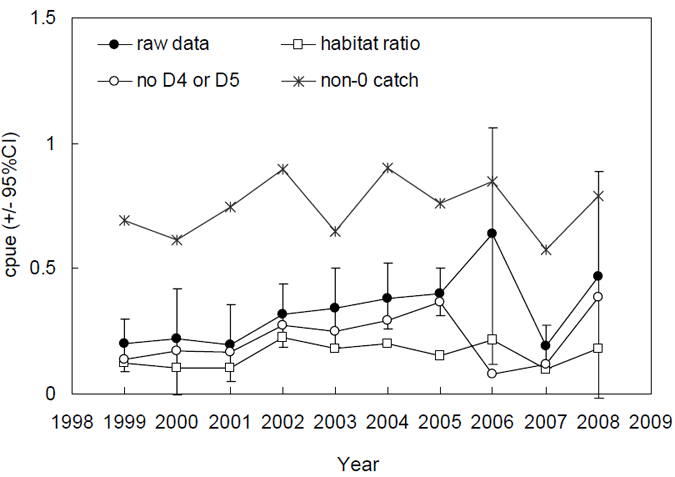
Figure 2. Annual trends in elephant fish targeted mean daily CPUE (number of fish / angler hour) from MAFFRI Ongoing Creel Survey and 2008 February–May Survey.
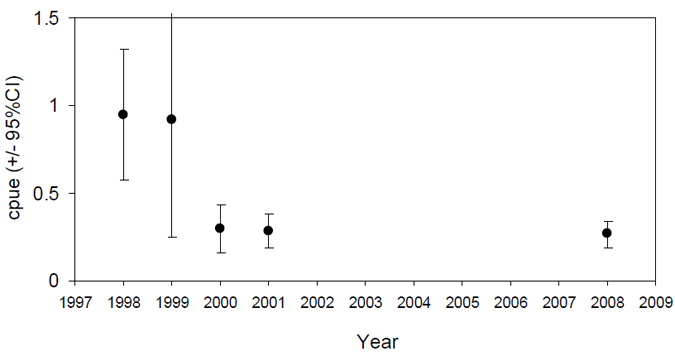
Figure 3. Annual trends in elephant fish targeted mean daily CPUE (number of fish / angler hour) from charter boat survey.
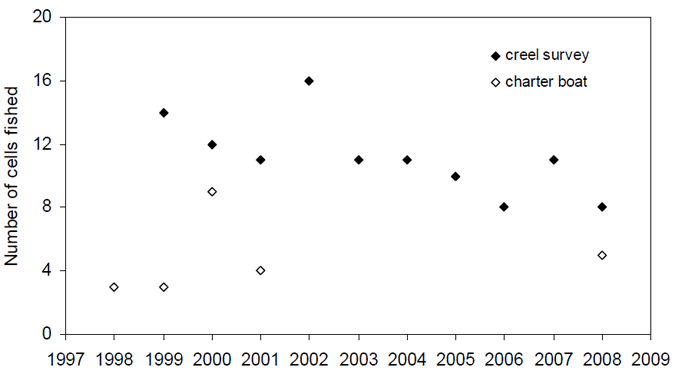
Figure 4. Number of fishing cells fished per year.
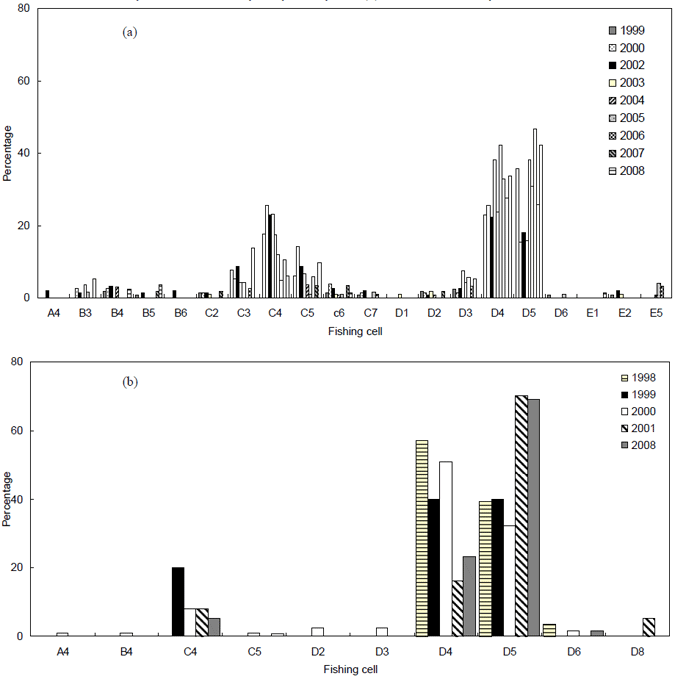
Figure 5. Percent frequency distributions of the fishing cells fished per year for (a) MAFFRI Ongoing Creel Survey and 2008 February–May Survey, and (b) charter boat survey.
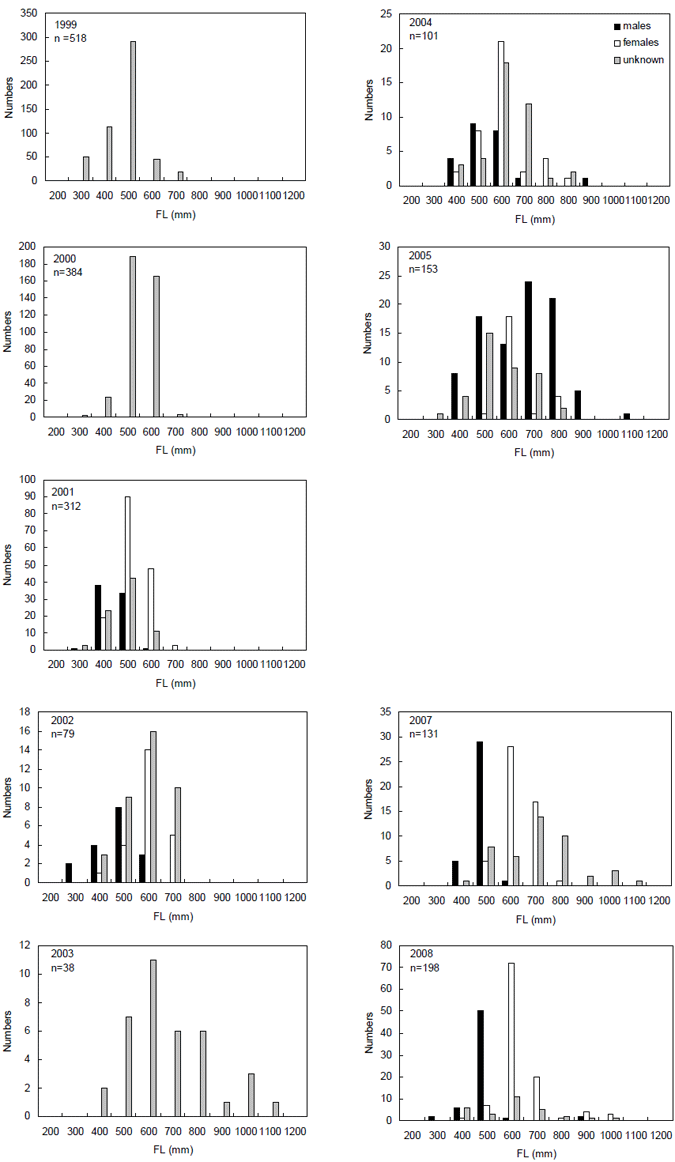
Figure 6. Length distribution of male and female elephant fish harvested (retained only) for each year surveyed in MAFFRI Ongoing Creel Survey and 2008 February–May Survey.
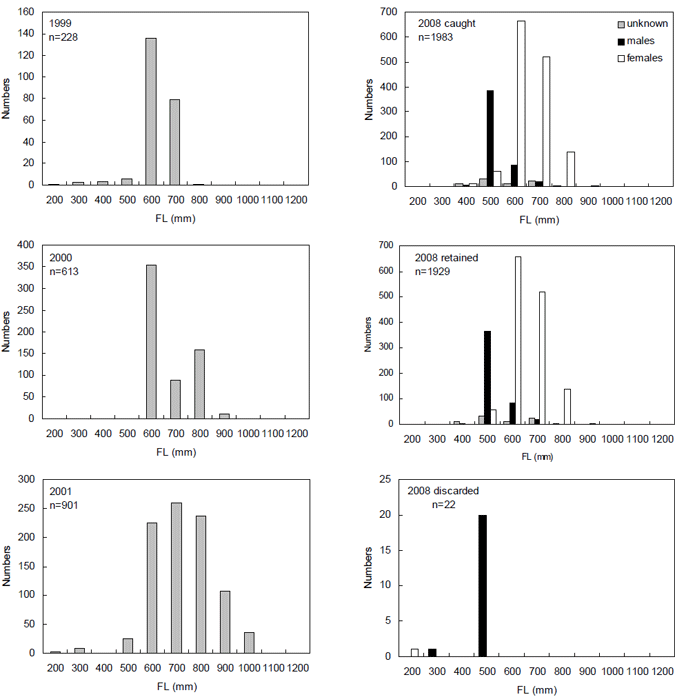
Figure 7. Length distribution of male and female elephant fish caught (retained and discarded) by charter boats.
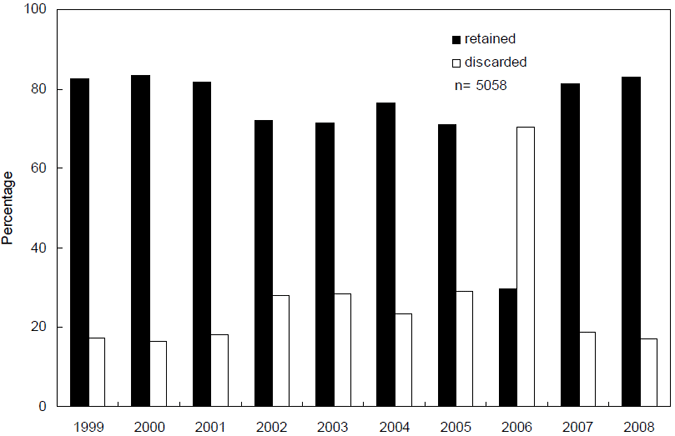
Figure 8. Annual percentage of retained and discarded elephant fish (MAFFRI Ongoing Creel Survey and 2008 February–May Survey).
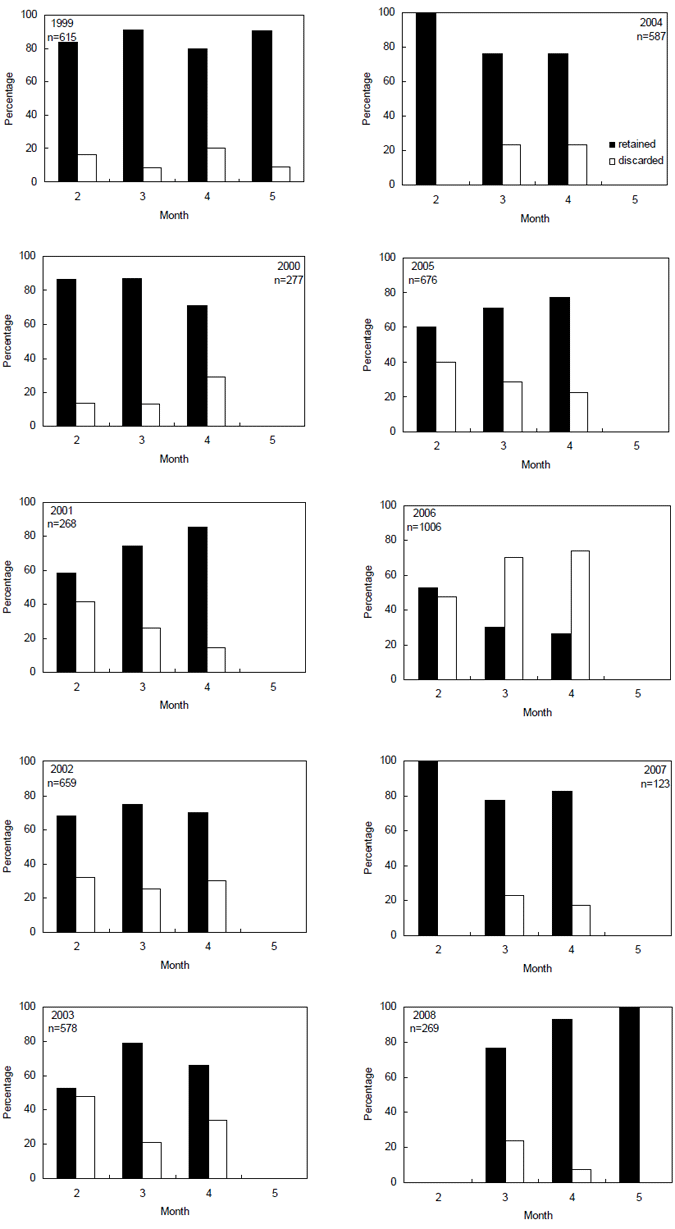
Figure 9. Monthly percentage of retained and discarded elephant fish (MAFFRI Ongoing Creel Survey and 2008 February–May Survey).
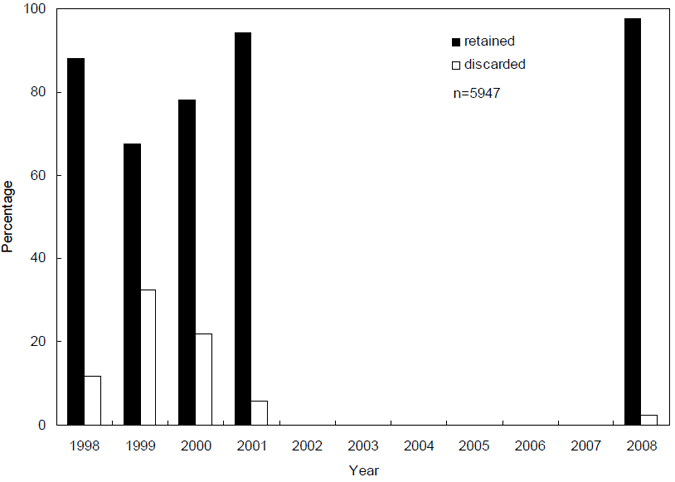
Figure 10. Annual percentage of retained and discarded elephant fish (charter boat survey).
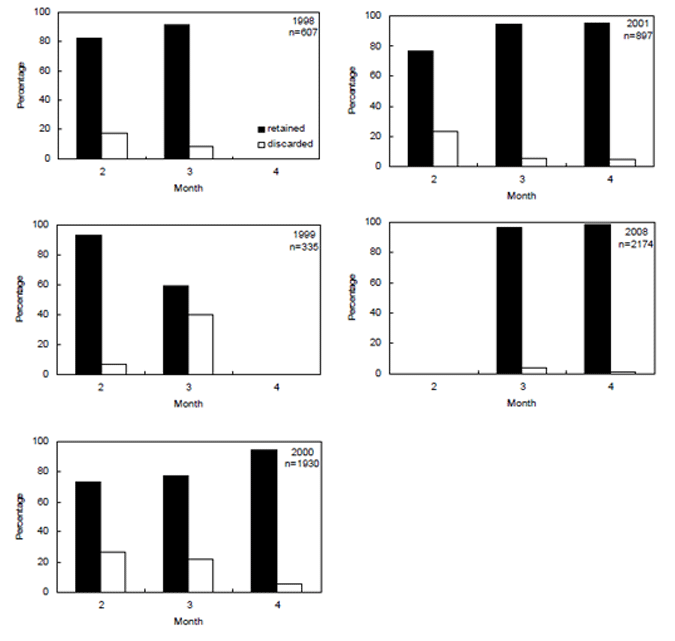
Figure 11. Monthly percentage of retained and discarded elephant fish (charter boat survey).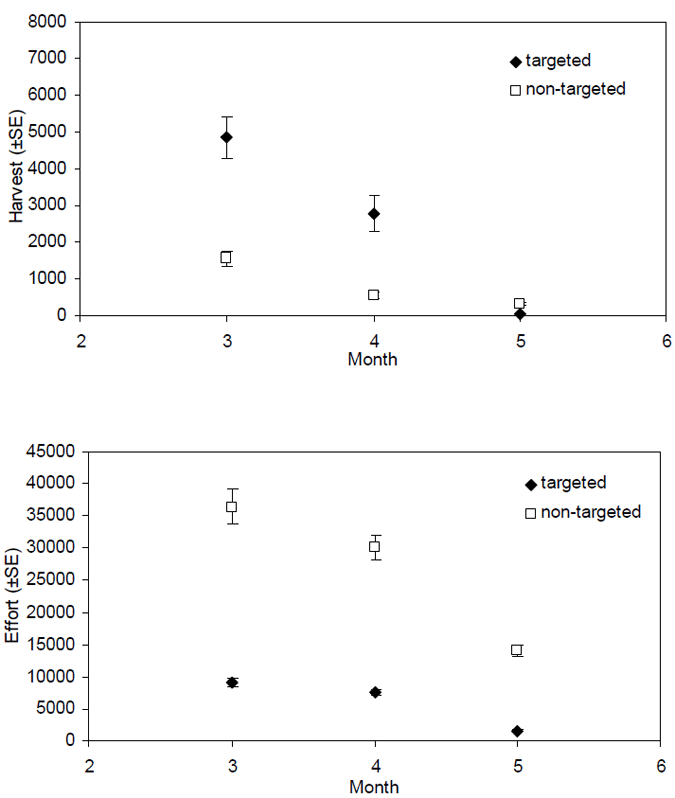
Figure 12. Monthly trends in elephant fish targeted and non-targeted harvest (in numbers) and effort (in party-hours) for 2008 February–May Survey.
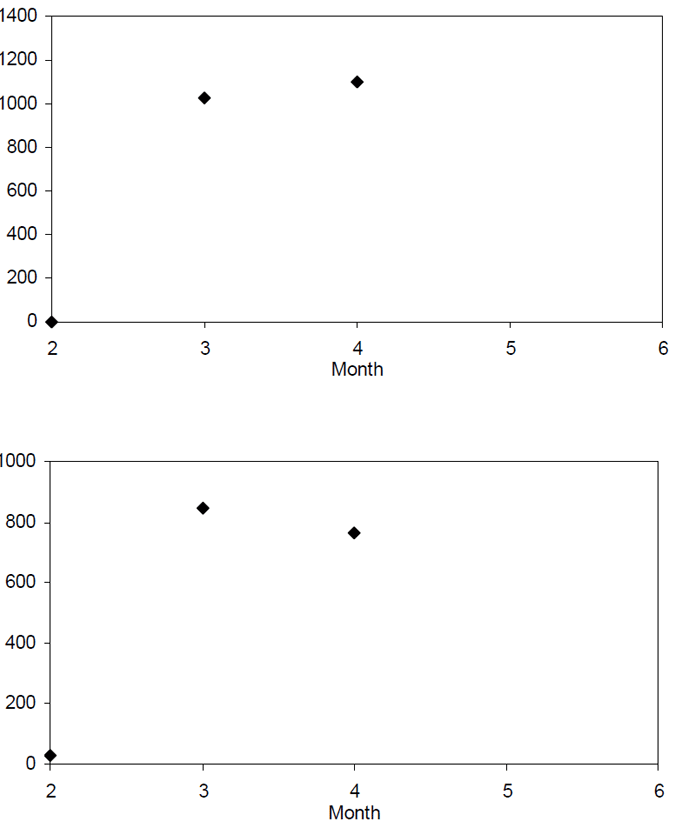
Figure 13. Monthly trends in elephant fish targeted harvest (in numbers) and effort (in angler-trip) for 2008 charter boat survey.
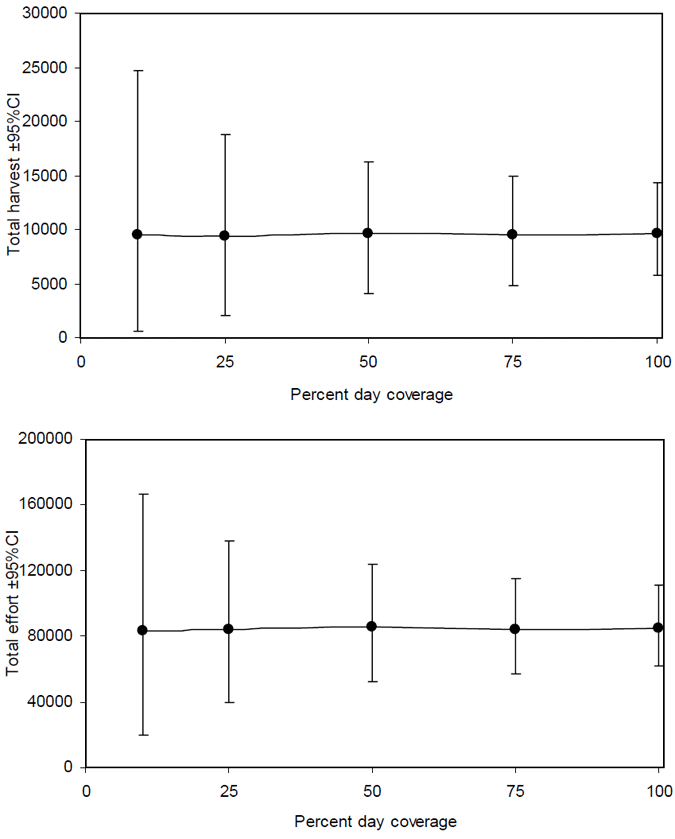
Figure 14. Bootstrapped 2008 February–May Survey mean harvest (in numbers) and mean effort (party-hours).
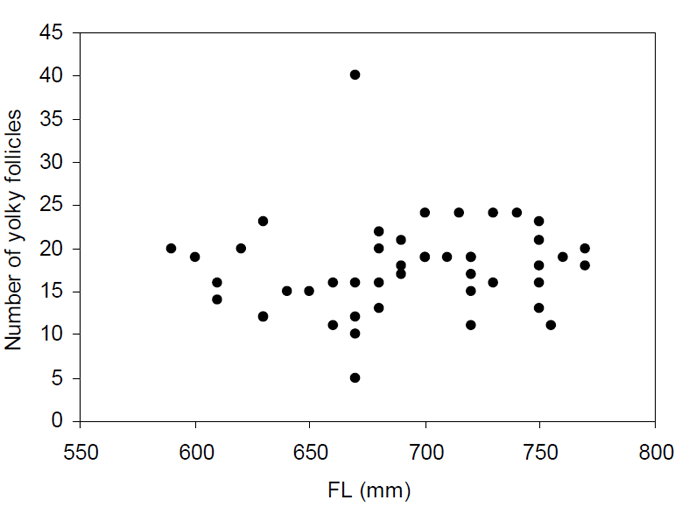
Figure 15. Relationship between maternal length and ovarian fecundity.
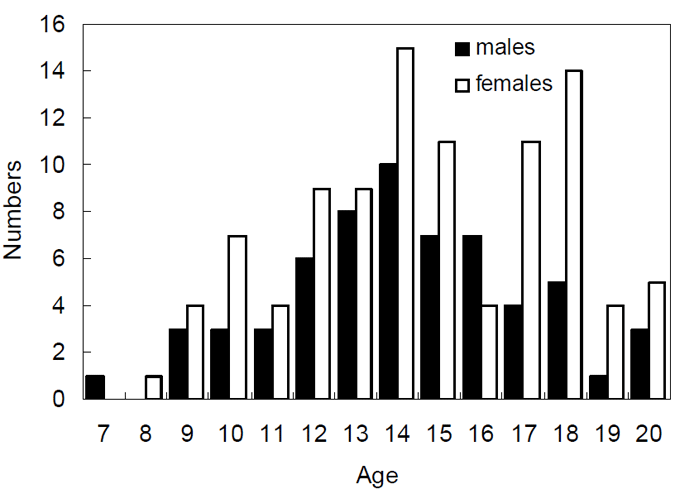
Figure 16. Age-frequency distribution by sex for retained elephantfish from 2008 February–May Survey.
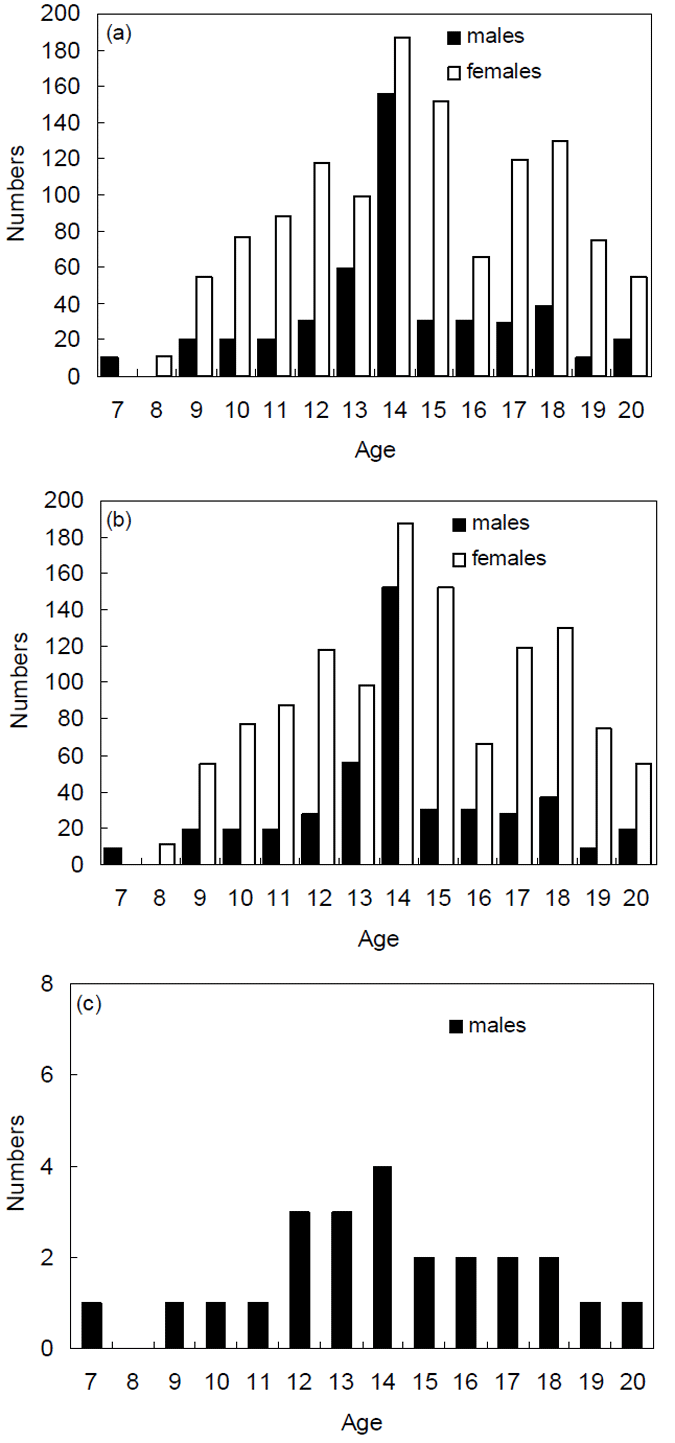 Figure 17. Age-frequency distribution by sex for (a) retained and discarded, (b) retained only, and (c) discarded only elephantfish from 2008 charter boat survey.
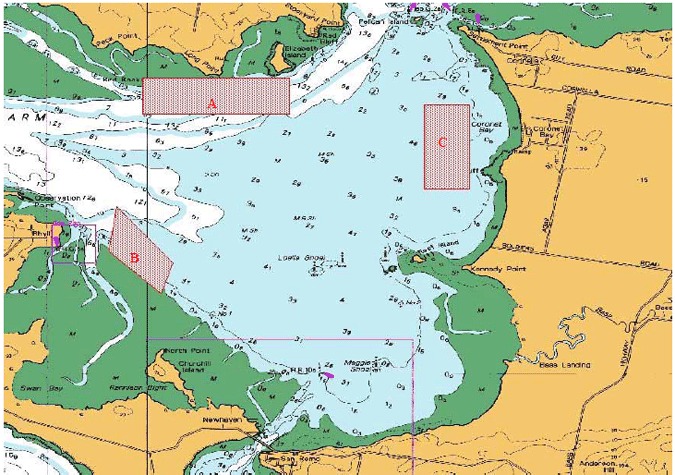
Figure 18. Areas with the highest aggregations of elephant fish in south-eastern Western Port: A, Bird Rock; B, Rhyll Bank; C, Coronet Bay.
Discussion
Recreational fishing catch
Trends in abundance and length-frequency composition of the catch
The annual elephant fish migration into Western Port occurs between February and May although the arrival and departure timing can vary among years. For some years, the migration into the bay occurs in early February whereas in other years it occurs in late February or early March. Similarly, the migration out of the bay occurs from late April to mid or late May in different years. Hence, the CPUE for February and May fluctuates considerably among years. March and April always show the highest CPUE across years, indicating that only these months should be used in annual CPUE trend analysis to minimize the variability related to migration timing rather than to trends in the relative abundance of the stock.
The elephant fish started to migrate into Western Port in large numbers around mid-1980s. For 1973–74, the elephant fish represented less than 1% of the total commercial catch of Western Port (230 tonnes) (Beinssen 1978). An increase in the commercial catch occurred after 1984 (Bell 2003). A recreational fishing survey conducted during January–May 1977 did not report elephant fish among the main species captured (Beinssen 1978).
The charter boat and creel surveys showed contrasting trends in annual CPUE. For the charter boat survey, a decline in CPUE was observed from 1998 to 2008, suggesting a decline in relative abundance. For the creel surveys, on the other hand, no clear trend in CPUE was observed regardless of using raw data, weighted data or when the catch 'hot-spots' were excluded. This suggests that the abundance within the bay remained relatively stable during surveyed years. The differences between the two surveys could be attributed to the better knowledge and skills of the charter boat operators in finding the elephant fish aggregations during the first two years surveyed (1998–99). From 2000 onwards, the CPUE values from the creel and charter boat surveys were similar possibly due to interviewed anglers improving their ability to find the aggregations.
The apparent stable trend in annual CPUE observed from the creel survey should be interpreted with caution when putting this information in a larger context. The value of using CPUE trends as an indicator of abundance relies on the assumption that CPUE is proportional to stock size, hence reflecting stock trends and responses to management regimes (Hilborn & Walters 1992). However, when fishing fish aggregations, hyperstability in CPUE trends can mask declining trends in abundance of the total stock. The creel survey data showed typical hyperstable characteristics, with an annual reduction in the number of fishing cells fished by anglers. Therefore, this information cannot be used to infer trends in the abundance of the total elephant fish stock in south-eastern Australia. Assuming that new individuals migrate into Western Port each year and fill in the bay to its carrying capacity and if the elephant fish stock-abundance outside Western Port declined, this decline would not be observed immediately when analysing CPUE trends for Western Port. This would be a result of the aggregating effect of the bay where elephant fish continue to enter Western Port to lay the eggs due to the unique characteristics of this bay. A tagging program (conventional and acoustic tagging) within Western Port is needed to determine whether despite a decline in the stock size, new individuals continue to replenish Western Port year after year, maintaining a relative stable annual CPUE regardless of the high fishing pressure experienced in this bay. A tagging program can also allow testing whether animals move in and out of the bay or remain inside the bay within a given season, and how the animals use the different habitats of Western Port. Finally, a tagging program could allow testing whether, within Western Port, elephant fish maintain a relatively high abundance in the hot-spot areas (where the effort is concentrated and hence from where the CPUE data are available) throughout the season regardless of a decline in abundance elsewhere within the bay.
Improved estimates of total catch and effort
For the first time, the elephant fish total harvest and total effort are available for a single year in Western Port. The total harvest (retained fish) during 2008 was 13,931 fish, of which 70% were females. This considerable previously unaccounted fishing mortality in Commonwealth assessments of elephant fish, particularly the mortality of breeding females, can have a considerable negative impact on the sustainability of the stock and therefore must be taken into account in the stock assessment process (see further discussion below). Sound management of elephant fish requires continued monitoring of annual catch and effort in Western Port—its prime egg-laying area in south-eastern Australia.
A monthly trend in catch and effort was observed for the 2008 February–May Survey, whereas no trend was observed for the charter boat survey. The drastic decline in catch recorded for the anglers interviewed during the 2008 February–May Survey compared with the stable trend observed in the charter boat catch could be due to the general better knowledge of elephant fish aggregating 'hot-spots' of charter boat operators who use their experience to maintain high catches during the charter trips. This was reflected in the larger number of fishing cells used by interviewed anglers (2008 February–May Survey) compared with the number of fishing cells used by charter boat operators. In addition, the monthly decline in catch observed from the 2008 February–May Survey suggests that the elephant fish migrates into Western Port in a single event with little replenishment after the initial migration. Tagging studies would allow testing of this hypothesis.
The most cost-effective method for calculating the total harvest and total effort for the elephant fish season in Western Port was specified. Recreational fishing surveys commonly provide moderate to large variability around the estimates of catch and effort. The bootstrapping analysis showed that even with 100% day coverage, there was still considerable variability around catch and effort estimates. Therefore, 50% day coverage (stratified by how fishing effort is distributed) is considered a cost-effective use of sampling resources to obtain reasonably precise catch and effort estimates.
Reproduction and ageing
Maturity ogives could not be drawn for male and female elephant fish collected in the surveys due to the lack of immature individuals. This shows that the recreational catch comprises mostly mature individuals. There was no clear relationship between maternal length or age and the number of yolky follicles, indicating that fecundity does not increase with maternal length as commonly found in other chondrichthyans. A very weak fecundity–maternal length relationship has been reported by Bell (2003).
The present study estimated maximum ages of 20 years for both males and females, indicating that this species is not a rapid growing species as previously considered. Slower growth translates into lower productivity. Given that current stock assessment models assume a faster growth rate and higher productivity (Walker & Hudson 2005), the present findings should be incorporated into the models to improve model predictions of biomass and pup production. This has been done in the assessment reported in Appendix 2.
Habitat requirements
In Western Port, elephant fish occur in highest numbers over muddy-sandy habitats located in the proximity of seagrass meadows. Other bays and inlets of comparable physiographic characteristics (e.g. Corner Inlet, Shallow Inlet, Portland and Warrnambool Harbours, the Barwon and Glenelg rivers) are also used by elephant fish as egg-laying grounds (Bell 2003). Females segregate from males to lay eggs over soft sediments with lower tidal and current movement. Eggs are designed for trapping sediments and anchoring themselves into the soft sediments (Bell 2003). There are almost no records of neonate occurrence in any particular habitat, but neonates can be found in the seagrass meadows (Braccini personal observation, Hyslop personal communication), suggesting that elephant fish may require a mix of specific habitats that would be essential for the early life history of this species. Soft sediments with lower current and tidal movement provide adequate habitat for anchoring the eggs to the substrate. The adjacent seagrass meadows provide the essential habitat and basic requirements needed by neonates, as commonly found for other fish species where seagrass meadows provide ideal nursery habitats (Blake & Ball 2001). This information is a starting point for a better delineation of the essential habitats within Western Port for the early life history of elephant fish. Further research is therefore needed to test these hypotheses given that no information on the location and abundance of eggs and neonates has been collected following a rigorous sampling design.
The migration of elephant fish in and out of Western Port appears to coincide with changes in water temperature and moon phase. However, it is still unclear what physiological and environmental cues trigger this migration. Western Port habitats have been considerably modified and degraded since European settlement (EPA 1996). Extensive losses of seagrass and macro algae occurred in Western Port during the 1980s followed by an increase in seagrass cover by 1999 (Blake & Ball 2001). The increase in abundance of elephant fish in Western Port coincided with the loss of seagrass observed during the mid-1980s (Bell 2003). For the abundance hot-spot areas delineated in this study, much larger seagrass cover was observed in the 1970s before elephant fish started using Western Port although signs of regrowth have been observed (Blake & Ball 2001). In light of the reported increase in seagrass cover during the late 1990s, further research is needed through more in depth and specific field data collection and experimental manipulation to test the apparent negative correlation between seagrass cover and the increase in elephant fish abundance in Western Port through increased egg-laying habitats and also the possible elephant fish reliance on seagrass meadows
through essential habitat for neonates. Alternative hypotheses suggested to explain the use of Western Port as an egg-laying habitat need also to be tested. Elephant fish have little osmorregulation capacity, particularly in low salinity environments (Hyodo et al. 2007). In recent years, the winter-spring freshwater run-offs in Western Port have decreased, improving the suitability of Western Port as an egg-laying area (Bell, unpublished). Other factors could also determine the suitability of Western Port as an egg-laying ground for elephant fish. Turbidity has increased since European settlement due to draining of swamps, dam constructions, urbanisation, removal of native forest, and dredging (May & Stephens 1996). This is considered to have caused the observed decline in seagrass coverage during the 1980s. Inputs of nutrients, contaminants and freshwater have also increased (May & Stephens 1996). The turbidity–seagrass relationship and the effect of other interacting factors, such as nutrient and sediment inputs, commonly shaping the dynamics of bays and semi-enclosed water bodies, could therefore play a crucial role in determining the future suitability of Western Port as a critical habitat for the early life history of elephant fish.
Alternative harvesting strategies
The estimated total annual harvest of elephant fish is similar to its maximum sustainable yield (MSY). Our MSY estimates are based on the assumption that commercial and recreational fishers report catches precisely. Therefore, given the statistical uncertainty associated with the estimated maximum sustainable yield and the uncertainty associated with the estimated harvest from the recreational fishery in Western Port, there is a high risk of the current harvest levels being not sustainable. Furthermore, ~20% of elephant fish are discarded by anglers in Western Port each season. Hence, the total annual recreational fishing impact in Western Port would be higher than the estimated total annual harvest if a low proportion of the discarded individuals survive. This would further support a high probability of unsustainable total catch for all fisheries combined. Research on the post-capture survival of elephant fish in Western Port is therefore needed to determine the proportion of discarded fish that survive. This information is also relevant for the assessment of the benefits of reducing the current three-fish bag limit to one-fish bag limit, a management measure currently being evaluated. Predicting the effects of any of the management options of bag limits, closed seasons and closed areas is difficult in that the response is rarely proportional to the magnitude of the management action. Reducing the bag limit, length of season, or area fished to one third is unlikely to reduce the catch to one third if, for example, a large proportion of the discarded fish do not survive when released.
For the 2008 February–May Survey, 63% of the catch was taken in March. This suggests that potential seasonal closures would be more effective during this month if the targeted effort is not redistributed to April and May and female elephant fish completing the egg-laying process in March leave Western Port by April. Also, protecting females early during the egg-laying season would allow them to lay eggs before being captured.
Offshore surveys conducted in 1973–76 and 1998–01 (Walker et al. 2005) and 2006–08 (Braccini & Walker unpublished) report a decline in the CPUE of elephant fish for the whole of south-eastern Australia. Walker & Hudson (2005) predict a decline in biomass and pup production despite a reduction of elephant fish fishing effort in the commercial fisheries of Bass Strait. These independent findings corroborate the catch-per-unit effort-time-series adopted as indices of abundance for the stock assessment of elephant fish (Appendix 2).
Given that only a single estimate (2008) was used to estimate the total recreational harvest of elephant fish in Western Port and assess the sustainability of this species, future assessments could be improved if a time series of total harvest estimates in Western Port is established.
In Bass Strait, modifying mesh-size of gillnets would have little effect on sustainable yields. Maximum sustainable yield for Bass Strait and all of Victoria's bays and inlets is estimated at 120 tonnes, live mass annually, with the present predominant fishing method of 6-inch mesh-size gillnets. Increasing mesh-size to 7 inches would increase MSY to 125 tonnes or further increasing it to 8 inches would decrease MSY to 114 tonnes. Adopting non-selective gear would further decrease MSY to 98 tonnes. Altering mesh-size of gillnets or changing to non-selective gears would have negative effects on the management of shark species taken in Bass Strait and would increase bycatch. Furthermore, there would be little benefit to the elephant fish stock in reducing the catch by the TAC because evidence from tag and release indicate that survival of elephant fish caught in gillnets is very low. Any reduction in catch would have to be effected by reducing fishing effort, which would be disruptive to the rest of the shark fishery of southern Australia.
Conclusions
The elephant fish requires a mix of specific habitats essential for its early life history. Soft sediments provide adequate habitat for anchoring the eggs to the substrate. The adjacent seagrass meadows provide the essential habitat and basic requirements needed by neonates. However, further research is needed for a better delineation of the essential habitats within Western Port for the early life history of elephant fish.
The estimated total annual catch of elephant fish from the commercial fisheries of Bass Strait and the recreational catch of Western Port during 2008 is similar to the estimated maximum sustainable yield for the stock. Given the statistical uncertainty associated with the estimated maximum sustainable yield, the uncertainty associated with the estimated harvest from the recreational fishery in Western Port, and the uncertainty associated with the post-capture mortality of discarded elephant fish, there is a high risk of the current harvest levels not being sustainable. Further monitoring in Western Port would improve the recreational fishing total catch estimates to better determine the sustainability of the elephant fish total catches.
Acknowledgements
We are very grateful to the several charter boat operators who participated in the charter boat logbook and telephone surveys; their involvement and contribution were crucial for the successful completion of this research. We are also grateful to Justin Bell for his invaluable contribution of knowledge and experience on elephant fish in Western Port. Finally, we would like to thank Karina Ryan and Anne Gason for their invaluable help with data analyses and Andrew Both and John Tornatora for their help in sample collection.
References
Beinssen KHH (1978) Recreational and commercial estuarine fishing in Victoria: a preliminary study Bell JD (2003) Fisheries and reproductive biology of the elephant fish, Callorhinchus milii, in south-east Australia. Honours thesis, Deakin University, Victoria
Blake S, Ball D (2001) Victorian marine habitat database, seagrass mapping of Western Port. Report No. Marine and Freshwater Resources Institute Report No. 29, GeoSpatial Systems Section, MAFRI, Queenscliff, Victoria
Chen SX, Woolcock JL (1999) A condition for designing bus-route type access site surveys to estimate recreational fishing effort. Biometrics 55:799–804
Crone PR, Malvestuto SP (1991) Comparison of five estimators of fishing success from creel survey data on three Alabama reservoirs. American Fisheries Society Symposium 12:61–66
EPA (1996) The Western Port Marine Environment, Environment Protection Authority, Victoria Gunthorpe L, Hamer P (2000) Western Port fish habitats – 1998. Report No. Fisheries Victoria Assessment Report No 21, Compiled by the Fish Habitat Assessment Group. Marine and Freshwater Resources Institute Queenscliff, Victoria
Henry G, Lyle J (2003) The National Recreational and Indigenous Fishing Survey. Report No. Final Report to the Fisheries Research & Development Corporation and the Fisheries Action Program. Project No. 1999/158, NSW Fisheries Final Report Series No. 48. ISSN 1440–3544
Hilborn R, Walters CJ (1992) Quantitative fisheries stock assessment: choice, dynamics and uncertainty, Vol. Chapman &Hall, New York
Hyodo S, Bell JD, Healy JM, Kaneko T, Hasegawa S, Takei Y, Donald JA, Toop T (2007) Osmorregulation in elephant fish Callorhinchus milii (Holocephali), with special reference to the rectal gland. The Journal of Experimental Biology 210:1303–1310
Last PR, Stevens JD (1994) Sharks and rays of Australia, Vol. CSIRO Publishing, Melbourne, Australia Malvestuto SP (1995) Estimation of angler harvest rates for recreational fisheries using creel surveys: current limitations and options for improvement. In: Hancock DA (ed) Australian Society for Fish Biology Workshop Proceedings. Australian Society for Fish Biology, Canberra, Canberra 30–31 August
1994, p 80–87
Marsden MAH, Mallet CW, Donaldson AK (1979) Geological and physical setting, sediments, and environments, Western Port, Victoria. Marine Geology 30:11–46
May D, Stephens A (1996) The Western Port marine environment. Based on a report to the Environment Protection Authority by Consulting Environmental Engineers, Environment Protection Authority, Melbourne
Pollock KH, Hoenig JM, Jones CM, Robson DS, Greene CJ (1997) Catch rate estimation for roving and access point surveys. North American Journal of Fisheries Management 17:11–19 Pollock KH, Jones CM, Brown TL (1994) Angler survey methods and their applications in fisheries management, Vol. American Fisheries Society Special Publications 25, American Fisheries Society, Bethesda, Maryland
Punt AE, Walker TI, Gason AS (2004) Initial assessments of sawshark (Pristiophorus cirratus and P. nudipinnis) and elephant fish (Callorhinchus milii). In: Tuck GN, Smith ADM (eds) Stock assessment for South East and Southern Shark Fishery Species FRDC Project No 2001/005. CSIRO Marine Research, Hobart, Tasmania, p 335–369
Robson D, Jones CM (1989) The theoretical basis of an access site angler survey design.Biometrics 45:83–98
Ryan KL, Conron S, Morison AK, West L (2008) Evaluating methods of obtaining total catch estimates for individual Victorian bay and inlet recreational fisheries, Department of Primary Industries, Queenscliff, Victoria
Ryan KL, Morison AK, Conron S, Gason A (2007) Comparison of survey methods used to estimate recreational catch from Victorian Bays and Inlets, Primary Industries Research Victoria, Queenscliff, Victoria
Shapiro A (1975) Westernport Bay environmental study 1973–1974, Ministry for Conservation, Melbourne
Steffe AS, Chapman DJ (2003) A survey of daytime recreational fishing during the annual period, March 199 to February 2000, in Lake Macquarie, New South Wales. Report No. Final Report Series Report No 52, NSW Fisheries
Steffe AS, Murphy JJ, Chapman DD, Barret GP, Gray CA (2005) An assessment of changes in the daytime, boat-based recreational fishery of the Tuross Lake estuary following the establishment of a 'recreational fishing haven', NSW Department of Primary Industries, Cronulla, NSW
Sullivan KJ (1977) Age and growth of the elephant fish Callorhinchus milii (Elasmobranchii: Callorhynchidae). New Zealand Journal of Marine and Freshwater Research 11:745–753
Sumner NR, Williamson PC, Malseed BE (2002) A 12-month survey of recreational fishing in the Gascoyne bioregion of Western Australia during 1998–99. Report No. Fisheries Research Report No 139, Western Australia Department of Fisheries
Walker TI (2005) Reproduction in fisheries science. In: Hamlett WC (ed) Reproductive biology and phylogeny of Chondrichthyes: sharks, rays and chimaeras. Science Publishers Inc., Enfield, New Hampshire, p 81–127
Walker TI, Gason A (2007) Shark and other chondrichthyan byproduct and bycatch estimates in the southern and eastern scalefish and shark fishery. Report No. Final report to Fisheries Research and Development Corporation Project No 2001/007, Primary Industries Research Victoria, Queenscliff, Victoria
Walker TI, Gason AS (2005) GHATF monitoring database management 2004/0. Final report for Project No R03/1383, Australian Fisheries Management Authority, Canberra, ACT, Australia, Queenscliff, Victoria
Walker TI, Hudson RJ (2005) Sawshark and elephant fish assessment and bycatch evaluation in the Southern Shark Fishery. Report No. Project No 1999/103, Fisheries Research and Development Corporation
Walker TI, Hudson RJ, Gason AS (2005) Catch evaluation of target, by-product and by-catch species taken by gillnets and longlines in the shark fishery of south-eastern Australia. Journal of Northwest Atlantic Fishery Science 35:505–530 Evaluation of effects of targeting breeding elephant fish by recreational fishers in Western Port 31
Woolcock JL, Kinloch MA (1995) An assessment of the 'bus-route' method for estimating angler effort. In: Hancock DA (ed) Australian Society for Fish Biology Workshop Proceedings. Australian Society for Fish Biology, Canberra, Canberra 30–31 August 1994, p 88–93
Appendices
Please email chris.padovani@dpi.vic.gov.au for a copy of the appendices or the full report.
