State-wide Angler Diary Program 1997-2006
![]()
Recreational Fishing Grant Program - Research report
DOWNLOAD THE WORD VERSION OF THIS DOCUMENT: RECREATIONAL FISHING GRANT PROGRAM - RESEARCH REPORT  [MS Word Document - 4.3 MB]
PROJECT NUMBER:5/03/04/R
Natalie Bridge and Simon Conron.
APRIL 2010
Table of Contents
Executive Summary
Introduction
Methods
Angler diaries
Selection of anglers
Data analysis
Results
Angler diary returns and fish caught
Fishing trips by water type
Snapper
Snapper in Port Phillip Bay
Snapper in Western Port bay
King George Whiting
King George whiting in Port Phillip Bay
King George whiting in Western Port bay
Black Bream
Black bream in the Gippsland Lakes
Black bream in the Hopkins River
Black bream in Mallacoota Inlet
Black bream in Lake Tyers
Sand flathead
Trout
Trout in the Goulburn River
Golden Perch
Murray Cod
Follow up Survey
Collection of ageing samples
Discussion
Information on fish stocks in key marine fisheries
Potential of the Angler Fishing Diary Program to provide performance indicators for freshwater fisheries
Information to encourage continued involvement of recreational fishers in the monitoring of their recreational fisheries.
Conclusion
Acknowledgements
References
Appendix 1
Appendix 2
Appendix 3
List of Tables
List of Figures
Executive Summary
A state-wide Angler Fishing Diary Program was conducted in Victoria from 1997/98 to 2005/06. The principal objective of the Program was to provide a time-series of catch and effort information and size composition of key species that could be used as an indicator of the status of fish stocks.
Participating anglers were asked to record catch details in a fishing diary. By 2002/03, 123 anglers were contributing to the Angler Fishing Diary Program, but this declined to 69 anglers in 2005/06.
A time-series of catch rates and size composition information was generated for eight key species identified by Fisheries Victoria.
Catch data for under-size snapper in Port Phillip Bay indicated that the fishery had recently benefited from, and is likely to continue to benefit from, the recruitment of several stronger year-classes. In contrast, under-size snapper in Western Port bay were abundant only in some years.
Catch rates of King George whiting in both Port Phillip Bay and Western Port bay fluctuated throughout the study period. The catch rate of under-size whiting is not a good indicator of future recruitment to the fishery as under-size whiting were not vulnerable to the fishing gear used by whiting anglers.
Catch information from the Angler Fishing Diary Program is currently the only tool used to monitor the status of black bream stocks in Mallacoota Inlet, Lake Tyers and the Hopkins River, where commercial fishing is not permitted. The time series of catch rate and size composition information presented in this report indicates that the abundance of black bream stocks is in a fluctuating but stable state.
A declining trend in black bream catch rates in the Gippsland Lakes from 1998/99 to 2002/03, is consistent with a gap of several years since the last abundant bream year-class. Higher catch rates and the size compositions of catches reported by anglers in 2003/04 to 2005/06 indicate a slight increase in abundance of bream below the legal minimum length (LML).
Sand flathead catch rates in Port Phillip Bay fluctuated throughout the study period. This result is not consistent with the Port Phillip Bay annual trawl survey, which has shown a decline in sand flathead abundance since 1991.
Catch data from the Goulburn River for brown and rainbow trout, and from the Murray River for golden perch, showed no clear trends in abundance. This was partly due to the low number of fishing trips reported. Catch rates for Murray cod were lower than any of the other seven species in this report. Trends in catch data showed the potential for the Angler Fishing Diary Program to provide performance indicators for fish stocks both above and below the LML.
Follow up surveys were conducted on 1537 angler trips between June 2005 and March 2006. These surveys were used to determine the percentage of fishing trips that were not recorded and how many of these were estimated to have a zero catch. Of the non-reported trips, 35% were zero catches. The proportion of zero catches in non reported catches varied with nominated species. This is higher when compared with the proportion of zero catches in reported trips (11%). This bias can be addressed by clear instructions to anglers on how and why information should be recorded.
Limitations to the use of fishing diary data are considered. The more anglers reporting on a particular fishery, the less likely that the catches of any one angler will bias the results. The accuracy of advice on the status of fish stocks is likely to improve if it is based on catch data obtained from larger numbers of anglers.
Introduction
Fishery management requires regular assessments of fish stocks. Recreational anglers, unlike commercial anglers, are not required to provide records of catch and effort. It was considered that useful data could be obtained by a state-wide Angler Fishing Diary Program and this was established in 1997 (Conron and Bridge 2003). The program was continued in Victoria from 1997/98 to 2005/06.
The project tested the hypothesis that the catch and effort information recorded over time by skilled anglers could provide an index of the abundance of fish stock both above and below the Legal Minimum Length (LML). Records of the size composition of angler catches should provide indications of the impact of fishing and the basis for forecasting the timing and strength of future recruitment. This approach, with anglers voluntarily recording and reporting their own catch information, is a cost effective means of collecting basic data for management of recreational fisheries (Conron 2003). Regular staff-conducted surveys are an alternative but these are expensive.
This report reviews the information collected since 1997 on the catch, effort and size composition for key species in eight marine and fresh water regions popular with recreational anglers. During the course of the project a system was developed for collection of biological and ageing samples required for other fisheries research projects.
The objectives of the project were:
- To obtain information of fish stocks in key marine fisheries (snapper (Pagrus auratus), King George whiting (Sillaginodes punctata), black bream (Acanthopagrus butcheri) and sand flathead (Platycephalus bassensis))
- To assess the potential of the Angler Fishing Diary Program to provide performance indicators for freshwater fisheries
- To provide information to encourage continued involvement of recreational fishers in the monitoring of their recreational fisheries.
Methods
Angler diaries
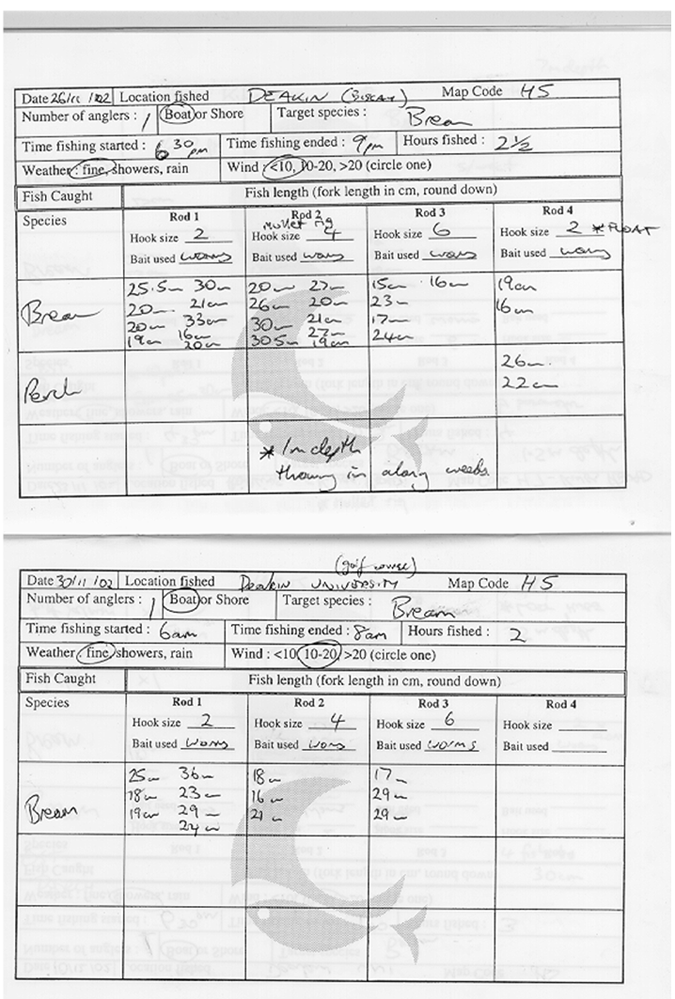
The angler fishing diary format (Appendix 1), developed in 1997, was specifically designed to monitor catch rates of black bream populations in Victorian estuaries. Participating anglers were asked to alter their fishing techniques in order to catch a broad size range of black bream.
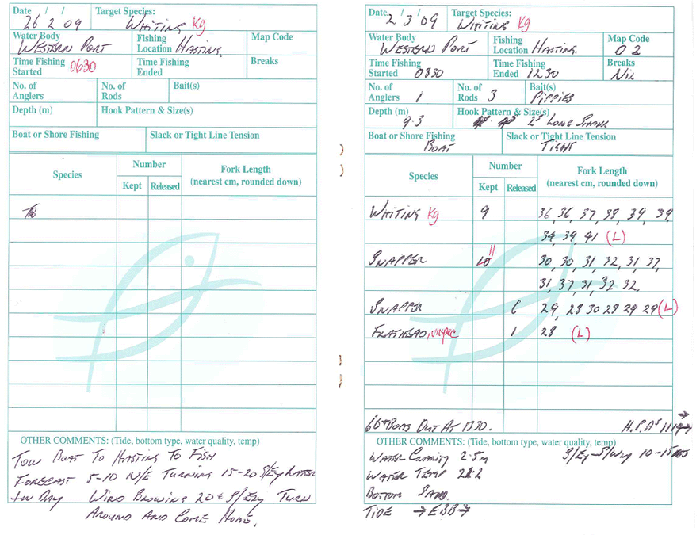
In 1999, a modification was introduced to cover a wider range of fisheries, fishing regions and fishing techniques, and to allow anglers to choose the level of detail they wished to record (Appendix 2).
Level 1 required records of date, target species, fishing location, fishing effort, number of rods, bait and hook type, species and number of fish retained and released. Level 2 required, in addition, the length of retained fish. At Level 3 the lengths of all fish, retained and released, were also recorded.
Anglers were provided with the diary, an explanatory letter and a ruler. They were asked to record every trip, whether successful or not, for their nominated target species and fishing region.
Anglers were instructed to record lengths, rounded down to the nearest whole centimetre. Total length (TL) was recorded for species with truncate or rounded caudal fins (including flathead). Fork length (FL; distance from the tip of the snout to the base of the tail fin) was recorded for species with emarginate or forked caudal fins (including snapper, King George whiting and black bream). Gummy (Mustelus antarcticus)and school (Galeorhinus galeus) sharks were measured from the most posterior gill slit to the base of the tail fin.
Space was provided for comments to be made in regard to each fishing trip. Replacement diaries were supplied, with anglers also receiving a hat and T-shirt promoting the Program. More regular contact (phone and letters) with the participating anglers has been undertaken since 2002/03. This contact has improved the retention of diary anglers to the Program.
A follow up survey by phone was carried out between June 2005 and March 2006 by DPI staff members. Follow up surveys were used to determine the percentage of fishing trips that were not recorded and how many of these were estimated to have a zero catch. Information about the level of non-reporting (i.e. the percentage of trips not recorded by diary anglers targeting key species in the main fisheries) was collected. Of particular interest was the number of non-reported trips estimated to have zero catches.
Biological and ageing samples were collected by experienced fishers as required.
Selection of anglers
Anglers recruited to the Program were volunteers who generally had a high degree of fishing expertise and an excellent knowledge of their preferred fishery. The existence of the Angler Fishing Diary Program was promoted through newsletters to fishing clubs, articles in newspapers and general "word of mouth" by department staff and anglers already involved in the Program.
Data analysis
Catch data from angler fishing diaries were entered into an Access database. A time series of catch rates and size composition information was generated for eight key target species in eight fishing regions of interest to Fisheries Victoria:
- Snapper in Port Phillip Bay and Western Port bay
- King George whiting in Port Phillip Bay and Western Port bay
- Black bream in the Gippsland Lakes, Hopkins River, Mallacoota and Lake Tyers
- Sand flathead in Port Phillip Bay
- Rainbow (Oncorhynchus mykiss) and brown (Salmo trutta) trout in the Goulburn River
- Golden perch (Macquaria ambigua) in the Murray River
- Murray cod (Maccullochella peelii) in the Murray River.
Mean catch rates for key target species were calculated from fishing trips where the species of interest was nominated as a target species. Total catch rates (all fish caught, retained and released) were calculated from angler diary catch information.
Mean catch rates were calculated using the ratio-of-means estimator (Jones et al. 1995). The "bootstrap" method was used to estimate confidence limits (CL) for the catch rate estimates, using a resample size ofn/2 (Efron and Tibshirani 1993). Size distributions (both retained and released) were generated for key species and water body.
Results are presented by financial year, considered to be the best representation of a single fishing season.
Results
Angler diary returns and fish caught
Over a nine year period (1997/98–2005/06), anglers participating in the Anger Fishing Diary Program provided information from more than 14,000 fishing trips (Table 1). The number of anglers who returned their fishing diaries increased from 16 in 1997/98 to 123 in 2002/03 then decreased to 72 in 2005/06. A similar trend was observed in the number of trips reported.
The number of fish caught (retained and released) and measured showed a general increase over the nine-year study period. The number of fish caught was reasonably constant (Table 1).
During 2005/06, 72 of the 261 anglers that were participating in the Program returned their diaries. Of the fish caught, 66% were measured, an improvement of 10% since 2002/03 when 56% of fish caught were measured.
Table 1 . Summary of fishing trips and catch details reported by anglers contributing to the Angler Fishing Diary Program (1997/98–2005/06).
|
Year |
No. of contributing anglers |
No. of trips |
No. of fish caught |
No. of fish measured |
|---|---|---|---|---|
|
1997/98 |
16 |
306 |
3,382 |
3,311 |
|
1998/99 |
50 |
857 |
13,797 |
8,120 |
|
1999/00 |
75 |
1,325 |
15,969 |
8,679 |
|
2000/01 |
82 |
1,424 |
17,744 |
8,132 |
|
2001/02 |
105 |
1,908 |
21,897 |
11,129 |
|
2002/03 |
123 |
2,385 |
22,069 |
12,323 |
|
2003/04 |
116 |
2,272 |
23,108 |
13,265 |
|
2004/05 |
94 |
2,232 |
25,451 |
15,938 |
|
2005/06 |
72 |
1,678 |
17,806 |
11,750 |
Fishing trips by water type
The majority of fishing trips reported were undertaken in marine/estuarine waters (Figure 1). The number of trips undertaken in freshwater remained constant from 2001/02–04/05 then declined in 2005/06.
The number of overall reported trips increased from approximately 500 trips in 1997/98 to over 4000 trips in 2003/04, and then declined to 3000 trips in 2005/06.
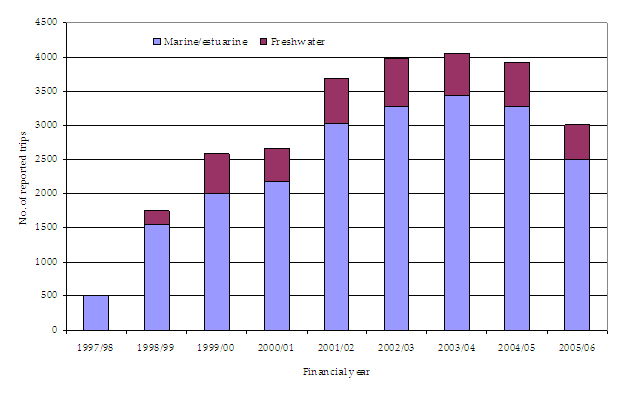
Figure 1. Number of reported fishing trips by water type and financial year for anglers contributing to the Angler Fishing Diary Program (1997/98–2005/06).
Snapper
Over the nine year period (1997/98–2005/06) between 44%–69% of annual angler hours targeting snapper were undertaken in Port Phillip Bay (Table 2). Snapper were also targeted in Western Port bay, the western coastal waters off Portland and to a lesser extent in other regions.
Table 2. Number of angler hours targeting snapper, by season and region, reported by anglers contributing to the Angler Fishing Diary Program (1997/98–2005/06).
| Region |
1997 - 98 |
1998 - 99 |
1999 - 00 |
2000 - 01 |
Year |
2002 - 03 |
2003 - 04 |
2004 - 05 |
2005 - 06 |
|---|---|---|---|---|---|---|---|---|---|
|
Port Phillip Bay |
124 |
424 |
578 |
1039 |
1264 |
1254 |
1297 |
947 |
896 |
|
Western Port bay |
237 |
315 |
244 |
409 |
96 |
204 |
362 |
302 |
|
|
Coastal Marine West |
25 |
287 |
153 |
90 |
32 |
192 |
229 |
229 |
109 |
|
Coastal Marine Central |
24 |
49 |
46 |
58 |
134 |
137 |
97 |
5 |
|
|
Coastal Marine East |
86 |
131 |
52 |
85 |
102 |
37 |
21 |
||
|
Other waters |
8 |
18 |
0 |
85 |
27 |
224 |
368 |
25 |
160 |
|
Total |
181 |
966 |
1181 |
1635 |
1842 |
1985 |
2337 |
1697 |
1493 |
SNAPPER IN PORT PHILLIP BAY
The number of fishing trips targeting snapper in Port Phillip Bay steadily increased from 54 trips in 1997/98 to a peak of 340 trips in 2002/03, then declined to 227 trips in 2005/06 (Table 3).
Table 3. Summary of fishing effort and snapper catches reported by anglers contributing to the Angler Fishing Diary Program who targeted snapper in Port Phillip Bay (1997/98–2005/06).
Year |
No. anglers |
No. trips |
Angler hours |
No. fish retained |
No. fish released |
|---|---|---|---|---|---|
|
1997/98 |
2 |
54 |
124 |
120 |
533 |
|
1998/99 |
10 |
131 |
424 |
516 |
611 |
|
1999/00 |
15 |
159 |
578 |
431 |
975 |
|
2000/01 |
21 |
266 |
1039 |
830 |
1209 |
|
2001/02 |
27 |
320 |
1264 |
654 |
3204 |
|
2002/03 |
33 |
340 |
1254 |
741 |
2115 |
|
2003/04 |
30 |
307 |
1297 |
772 |
1454 |
|
2004/05 |
28 |
240 |
947 |
507 |
1561 |
|
2005/06 |
18 |
227 |
896 |
619 |
1994 |
Annual angler hours increased from 124 in 1997/98 to 1297 hours in 2003/04, and then declined to 896 hours in 2005/06. Over the nine-year reporting period, anglers caught more than 18,800 snapper in Port Phillip Bay, 73% of which were released.
Estimated mean total catch rates of snapper (retained and released) targeted by anglers in Port Phillip Bay were higher in 1998/99 (4 fish per trip) than in subsequent years. Mean catch rates have remained stable at 2 fish per trip or just under since 2001/02 (Appendix 4 Figure 15).
The size distribution of snapper (retained and released) indicates a progression of four size groups/year classes into the Port Phillip Bay fishery, resulting from successful spawning seasons in 1995/96, 1997/98, 2000/01 and 2003/04 (Figure 2).
The average length of snapper was 27 cm TL. Forty two percent (n = 13,042) of fish measured were above the LML of 27 cm TL.
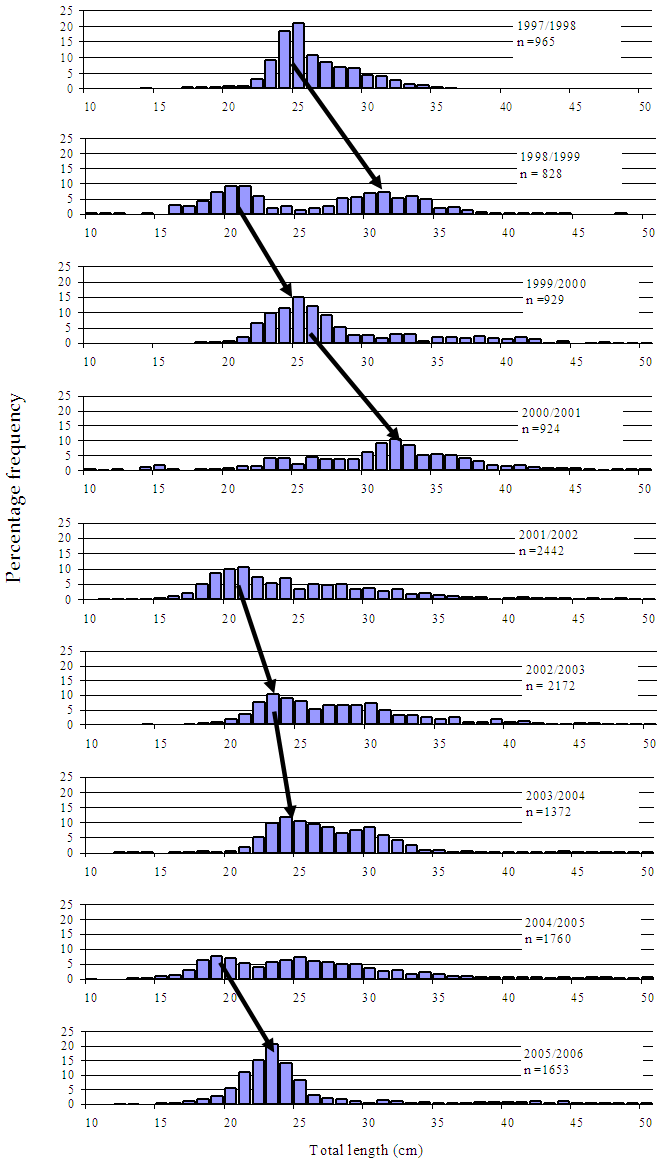
Figure 2. Size composition of snapper caught (retained and released) by diary anglers in Port Phillip Bay from 1997/98 to 2005/06 (n = number of fish measured).
SNAPPER IN WESTERN PORT BAY
The number of fishing trips targeting snapper in Western Port bay fluctuated between 53 and 80 trips by 5–11 anglers from 1998/99 to 2001/02 (Table 4). The number of trips declined to 29 in 2002/03 then increased to 76 trips by 10 anglers in 2004/05.
Annual angler hours ranged from 237 to 409 hours from 1998/99 to 2001/02, declined to 96 hours in 2002/03, and then increased to 362 hours in 2004/05 (Table 4). Anglers caught more than 1400 snapper in Western Port bay over the nine-year reporting period (1997/98–2005/06), of which 76% were retained.
Table 4 . Summary of fishing effort and snapper catches reported by anglers contributing to the Angler Fishing Diary Program who targeted snapper in Western Port bay (1997/98–2005/06).
Year |
No. anglers |
No. trips |
Angler hours |
No. fish retained |
No. fish released |
|---|---|---|---|---|---|
|
1997/98 |
|||||
|
1998/99 |
11 |
63 |
237 |
152 |
23 |
|
1999/00 |
9 |
75 |
315 |
96 |
4 |
|
2000/01 |
11 |
53 |
244 |
153 |
35 |
|
2001/02 |
11 |
80 |
409 |
123 |
27 |
|
2002/03 |
8 |
29 |
96 |
46 |
99 |
|
2003/04 |
6 |
55 |
204 |
220 |
70 |
|
2004/05 |
10 |
76 |
362 |
224 |
67 |
|
2005/06 |
5 |
65 |
302 |
108 |
20 |
Estimated mean total catch rates of snapper (retained and released) targeted by anglers in Western Port bay (Appendix 4 Figure 16) fluctuated between 1.3 and 2.9 fish per trip, except for 2002/03 when 3.7 fish per trip were caught.
The numbers of fish measured annually in Western Port bay were low (Figure 3), but the size distribution of snapper (retained and released) shows a stronger than average pre-recruit year-class in 2002/03, which can be seen again in 2003/04. There was a higher proportion of larger snapper in Western Port bay compared with Port Phillip Bay (Figure 3 c.f. Figure 2). The average length of snapper in Western Port bay was 36 cm TL; 86% (n = 805) of fish measured were above the LML.
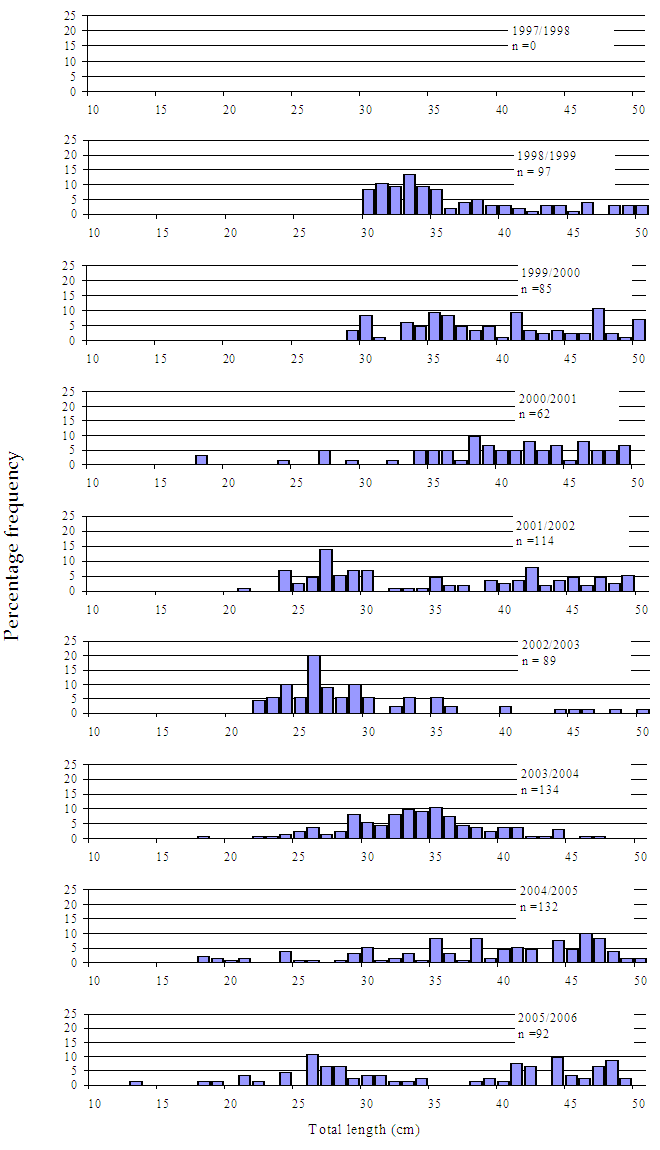
Figure 3. Size composition of snapper caught (retained and released) by diary anglers in Western Port bay from 1998/99 to 2005/06 (n = number of fish measured).
King George Whiting
Western Port bay and Port Phillip Bay were the preferred regions fished by anglers targeting King George whiting (Table 5). Several anglers also targeted King George whiting in coastal waters in the west of the state off Warrnambool and Portland and in the central coastal waters off Torquay.
Table 5 . Number of angler hours targeting King George whiting, by season and fishing region, reported by anglers contributing to the Angler Fishing Diary Program (1997–2006).
|
Region |
1997 - 98 |
1998 - 99 |
1999 - 00 |
2000 - 01 |
Season |
2002 - 03 |
2003 - 04 |
2004 - 05 |
2005 - 06 |
|---|---|---|---|---|---|---|---|---|---|
|
Port Phillip Bay |
242 |
446 |
328 |
359 |
576 |
504 |
473 |
338 |
227 |
|
Western Port bay |
805 |
1085 |
821 |
847 |
587 |
647 |
816 |
741 |
|
|
Coastal Marine West |
10 |
34 |
91 |
33 |
116 |
225 |
152 |
165 |
38 |
|
Coastal Marine Central |
39 |
12 |
7 |
9 |
76 |
82 |
120 |
68 |
9 |
|
Coastal Marine East |
8 |
11 |
18 |
10 |
|||||
|
Gippsland Lakes |
3 |
5 |
50 |
28 |
23 |
33 |
9 |
||
|
Other estuaries |
3 |
7 |
2 |
11 |
19 |
69 |
73 |
||
|
Total |
291 |
1300 |
1529 |
1240 |
1676 |
1463 |
1484 |
1503 |
1047 |
KING GEORGE WHITING IN PORT PHILLIP BAY
The number of fishing trips undertaken by diary anglers targeting King George whiting in Port Phillip Bay fluctuated between 71 and 132 trips per year over the study period (Table 6). Annual angler hours ranged between 227 and 576 hours. Over the nine-year reporting period, anglers caught over 6800 King George whiting in Port Phillip Bay of which 80% were retained.
Estimated mean total catch rates of King George whiting (retained and released) targeted by anglers in Port Phillip Bay fluctuated between 3.3 and 6.5 fish per trip, with an average of about 5 fish per trip over the nine year period (Appendix 4 Figure 17).
The size distribution of King George whiting (retained and released) caught by diary anglers ranged from 13 to 49 cm TL during 1997–2006. There were no indications of distinct size groups or year classes until 2002/03–2003/04 (Figure 4). The average length of King George whiting caught in Port Phillip Bay was 31 cm TL. A total of 75% (n=5943) of fish were above the LML (27 cm TL).
Table 6. Summary of fishing effort and King George whiting catches reported by anglers contributing to the Angler Fishing Diary Program who targeted King George whiting in Port Phillip Bay (1997/98–2005/06).
|
Year |
No. anglers |
No. trips |
Angler hours |
No. fish retained |
No. fish released |
|---|---|---|---|---|---|
|
1997/98 |
3 |
90 |
242 |
536 |
130 |
|
1998/99 |
7 |
122 |
446 |
892 |
196 |
|
1999/00 |
14 |
99 |
328 |
644 |
78 |
|
2000/01 |
12 |
109 |
359 |
395 |
35 |
|
2001/02 |
15 |
132 |
576 |
409 |
141 |
|
2002/03 |
25 |
128 |
504 |
888 |
208 |
|
2003/04 |
19 |
119 |
473 |
788 |
213 |
|
2004/05 |
14 |
95 |
338 |
447 |
218 |
|
2005/06 |
9 |
71 |
227 |
433 |
173 |
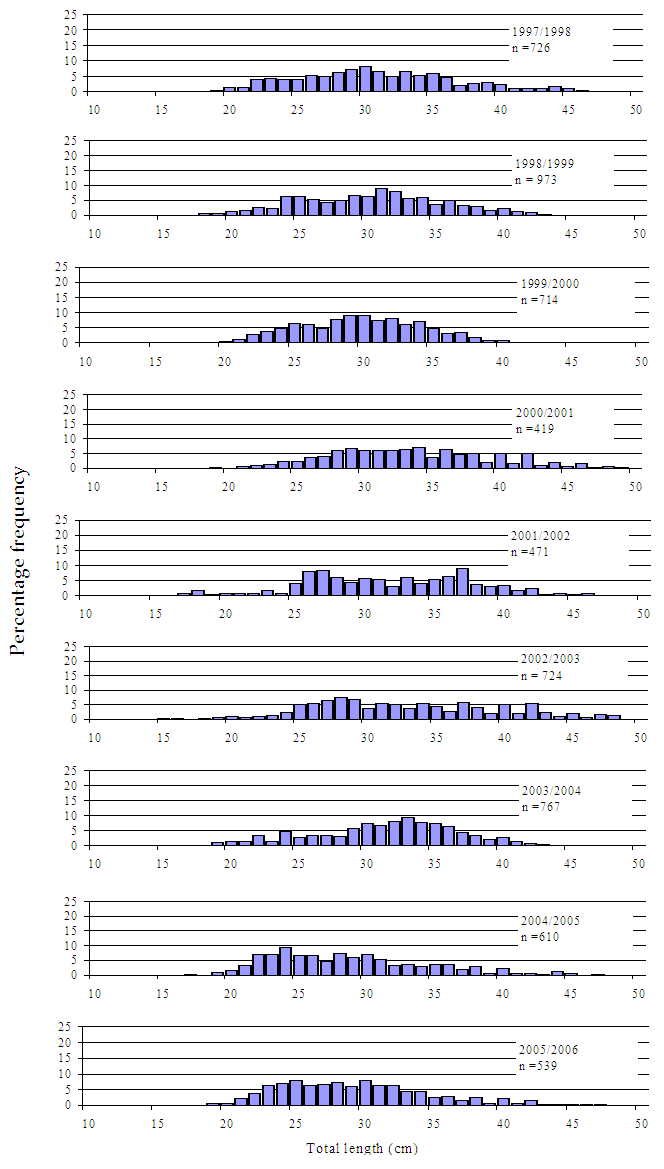
Figure 4 . Size composition of King George whiting caught (retained and released) by diary anglers in Port Phillip Bay from 1997/98 to 2005/06 (n = number of fish measured).
KING GEORGE WHITING IN WESTERN PORT BAY
The number of fishing trips undertaken by diary anglers targeting King George whiting in Western Port bay fluctuated between 134 and 211 trips per year over the study period (1997/98–2005/06), from a relatively constant number of contributing anglers (Table 7). No diary anglers targeted King George whiting in Western Port bay in 1997/98.
Annual angler hours ranged between 587 and 1085 hours. Over the eight-year reporting period, anglers caught over 13,600 King George whiting of which 94% of these were retained.
Table 7. ummary of fishing effort and King George whiting catches reported by anglers contributing to the Angler Fishing Diary Program who targeted King George whiting in Western Port bay (1997/98–2005/06).
|
Year |
No. anglers |
No. trips |
Angler hours |
No. fish retained |
No. fish released |
|---|---|---|---|---|---|
|
1997/98 |
|||||
|
1998/99 |
17 |
177 |
805 |
1967 |
110 |
|
1999/00 |
16 |
211 |
1085 |
2445 |
112 |
|
2000/01 |
17 |
169 |
821 |
1197 |
63 |
|
2001/02 |
14 |
166 |
847 |
993 |
96 |
|
2002/03 |
15 |
134 |
587 |
855 |
67 |
|
2003/04 |
13 |
145 |
647 |
1383 |
137 |
|
2004/05 |
16 |
181 |
816 |
2525 |
178 |
|
2005/06 |
10 |
156 |
741 |
1386 |
121 |
Estimated mean total catch rates of King George whiting (retained and released) targeted by anglers in Western Port bay declined from 9.1 fish per trip during 1998/99 to 4.9 fish per trip during 2000/01 and remained at this level for the next two years (2001/02–2002/03) (Appendix 4 Figure 18). Catch rates increased to 10.8 fish per trip in 2004/05 before decreasing to 6.7 fish per trip in 2005/06.
The size distribution of King George whiting (retained and released) in Western Port bay ranged from 10 to 50 cm TL during 1998–2006. There were no indications of distinct size groups or year classes (Figure 5). The average length of King George whiting in Western Port bay was 37 cm TL; 98% (n = 10,183) were above the LML. King George whiting caught in Western Port bay were generally larger than those caught in Port Phillip Bay (Figure 4 c.f. Figure 5).
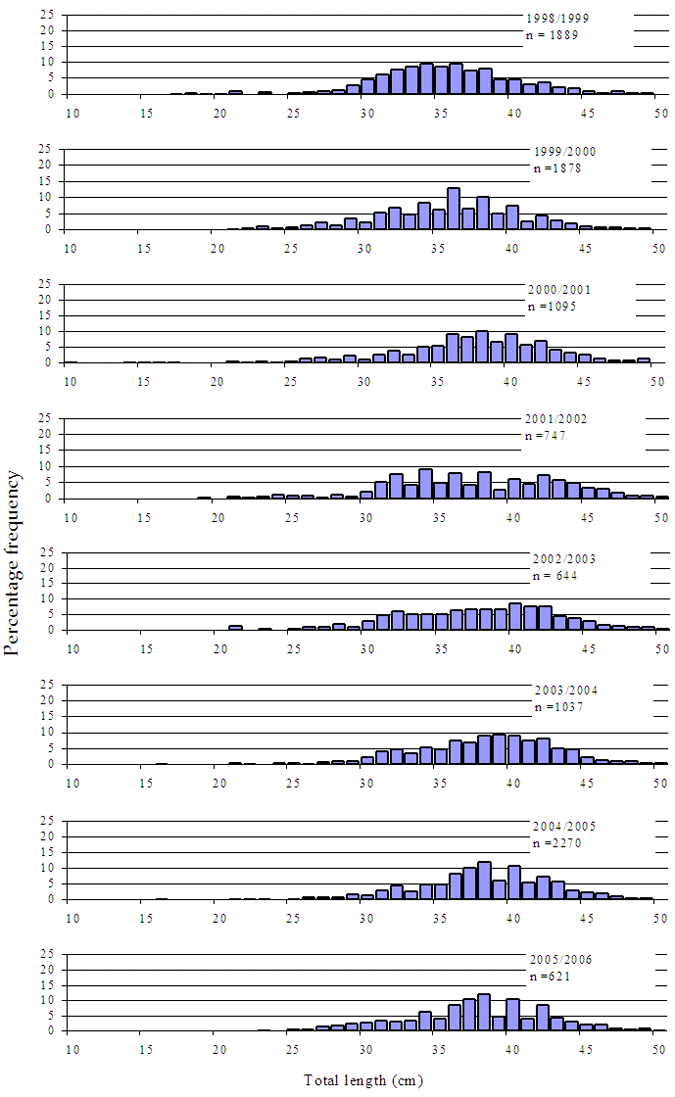
Figure 5. Size composition of King George whiting caught (retained and released) by diary anglers in Western Port bay from 1998/99 to 2005/06 (n = number of fish measured).
Black Bream
Anglers contributing to the Angler Fishing Diary Program fished for black bream in Victorian estuaries including the Gippsland Lakes, Hopk ins River and Mallacoota Inlet (Table 8).
Table 8. Number of angler hours targeting black bream, by season and water body, reported by anglers contributing to the Angler Fishing Diary Program (1997/98–2005/06).
|
Water body |
1997 - 98 |
1998 - 99 |
1999 - 00 |
2000 - 01 |
Season |
2002 - 03 |
2003 - 04 |
2004 - 05 |
2005 - 06 |
|---|---|---|---|---|---|---|---|---|---|
|
Gippsland Lakes |
430 |
389 |
507 |
555 |
476 |
257 |
407 |
990 |
428 |
|
Hopkins River |
54 |
114 |
76 |
111 |
453 |
380 |
397 |
183 |
76 |
|
Port Phillip Bay |
58 |
53 |
51 |
86 |
167 |
122 |
52 |
75 |
|
|
Glenelg River |
111 |
178 |
124 |
66 |
112 |
63 |
46 |
12 |
21 |
|
Mallacoota Inlet |
73 |
33 |
65 |
184 |
18 |
212 |
105 |
377 |
169 |
|
Lake Tyers |
7 |
148 |
226 |
164 |
117 |
156 |
|||
|
Sydenham Inlet |
21 |
44 |
0 |
5 |
66 |
201 |
201 |
53 |
|
|
Betka River |
79 |
70 |
67 |
33 |
87 |
54 |
9 |
0 |
|
|
Snowy River |
17 |
9 |
0 |
46 |
81 |
93 |
12 |
61 |
0 |
|
Other estuaries |
2 |
14 |
14 |
57 |
107 |
314 |
314 |
245 |
315 |
|
Total |
687 |
895 |
953 |
1148 |
1519 |
1979 |
1842 |
2249 |
1146 |
BLACK BREAM IN THE GIPPSLAND LAKES
The number of fishing trips undertaken by diary anglers targeting black bream in the Gippsland Lakes ranged from 75 trips in 1998/99 to 241 trips in 2004/05 (Table 9). The number of anglers contributing to the Program increased from one angler in 1997/98 to 14 anglers in 2003/04; 9 anglers contributed in 2005/06.
Angler hours ranged from 257 hours in 2002/03 to 992 hours in 2004/05. Over the nine-year reporting period, anglers caught over 6200 black bream in the Gippsland Lakes, of which 77% were released.
Estimated mean total catch rates of black bream (retained and released) from targeted catches in the Gippsland Lakes fluctuated between 0.8 and 1.9 fish per trip over the study period (Appendix 4 Figure 19).
The size distribution of black bream (retained and released) in the Gippsland Lakes ranged from 10 to 50 cm TL and showed a size group/year class moving through from 1997/98 to 2001/02, and a new size group/year class appearing in 2002/03 to 2004/05 (Figure 6). The average length of black bream in the Gippsland Lakes over the nine-year reporting period was 25 cm TL. The LML for black bream in the Gippsland Lakes changed from 26 cm to 28 cm TL in October 2003. Approximately 37% (n=5821) of fish measured were above these LMLs for the nine-year reporting period.
Table 9. Summary of fishing effort and black bream catches reported by anglers contributing to the Angler Fishing Diary Program who targeted black bream in the Gippsland Lakes (1997/98–2005/06).
|
Year |
No. anglers |
No. trips |
Angler hours |
No. fish retained |
No. fish released |
|---|---|---|---|---|---|
|
1997/98 |
1 |
86 |
430 |
31 |
680 |
|
1998/99 |
4 |
75 |
389 |
55 |
483 |
|
1999/00 |
8 |
86 |
507 |
129 |
407 |
|
2000/01 |
5 |
118 |
555 |
161 |
614 |
|
2001/02 |
9 |
143 |
476 |
149 |
198 |
|
2002/03 |
12 |
102 |
257 |
63 |
193 |
|
2003/04 |
14 |
112 |
407 |
159 |
479 |
|
2004/05 |
9 |
241 |
992 |
451 |
1051 |
|
2005/06 |
9 |
121 |
428 |
258 |
716 |
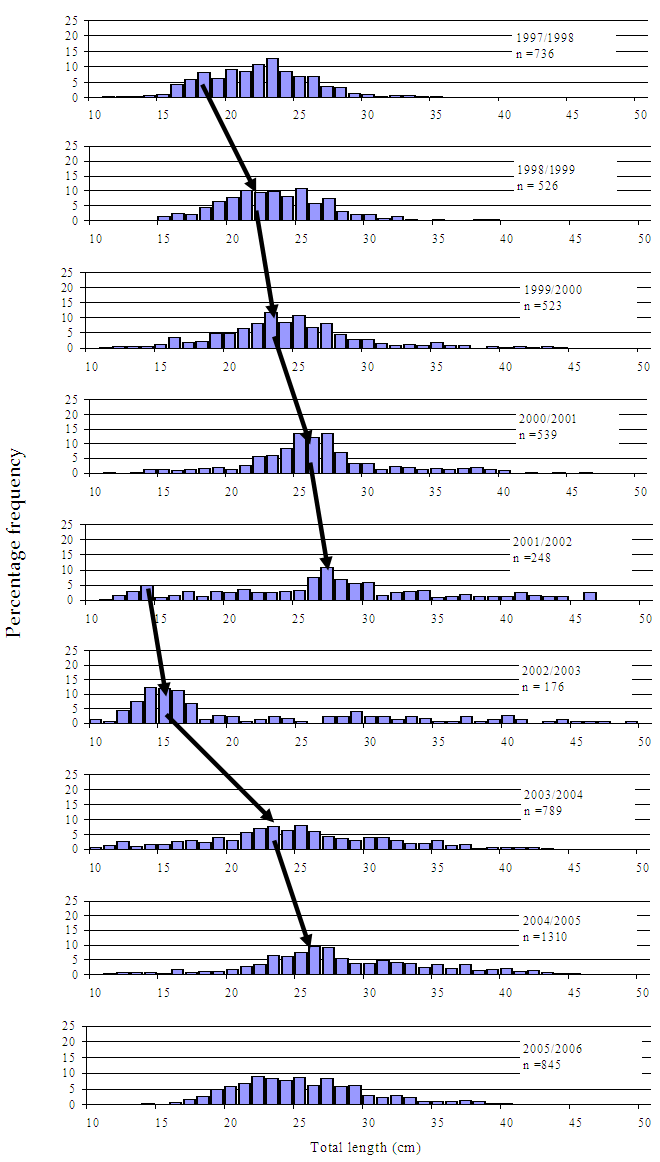
Figure 6. Size composition of black bream caught (retained and released) by diary anglers in the Gippsland Lakes from 1997/98 to 2005/06 (n = number of fish measured).
BLACK BREAM IN THE HOPKINS RIVER
The number of fishing trips undertaken by diary anglers targeting black bream in the Hopkins River ranged from 17 trips in 1997/98 to 110 trips in 2001/2002; 22 trips were undertaken in 2005/06 (Table 10). The number of anglers contributing to the Program increased from one angler in 1997/98 to 10 anglers in 2001/02, and declined to five anglers in 2005/06. Over the nine-year reporting period, anglers caught over 3500 black bream, 50% of these were retained.
Table 10. Summary of fishing effort and black bream catches reported by anglers contributing to the Angler Fishing Diary Program who targeted black bream in the Hopkins River (1997/98–2005/06).
|
Year |
No. anglers |
No. trips |
Angler hours |
No. fish retained |
No. fish released |
|---|---|---|---|---|---|
|
1997/98 |
1 |
17 |
54 |
78 |
44 |
|
1998/99 |
3 |
30 |
114 |
112 |
95 |
|
1999/00 |
3 |
19 |
76 |
52 |
28 |
|
2000/01 |
5 |
33 |
111 |
68 |
97 |
|
2001/02 |
10 |
110 |
453 |
464 |
341 |
|
2002/03 |
8 |
91 |
380 |
359 |
443 |
|
2003/04 |
9 |
104 |
397 |
385 |
366 |
|
2004/05 |
9 |
54 |
183 |
163 |
255 |
|
2005/06 |
5 |
22 |
76 |
64 |
99 |
Estimated mean total catch rates of black bream (retained and released) from targeted catches in the Hopkins River declined from 3.1 fish per trip in 1998/99 to 2.1 fish per trip in 2000/01. The catch rate increased to 3.9 fish per trip in 2002/03 and decreased to 3.1 fish per trip in 2005/06 (Appendix 4, Figure 20).
The size distribution of black bream (retained and released) in the Hopkins River showed a progression of four size groups/year classes moving through the fishery from 1997/98 to 1998/99, 1999/00 to 2001/02, 2001/02 to 2002/03, and 2002/03 to 2004/05 (Figure 7). Black bream in the Hopkins River ranged from 12 to 49 cm TL, the average length was 29 cm, and 72% (n=3046) of fish measured were above the LML (26 cm TL).
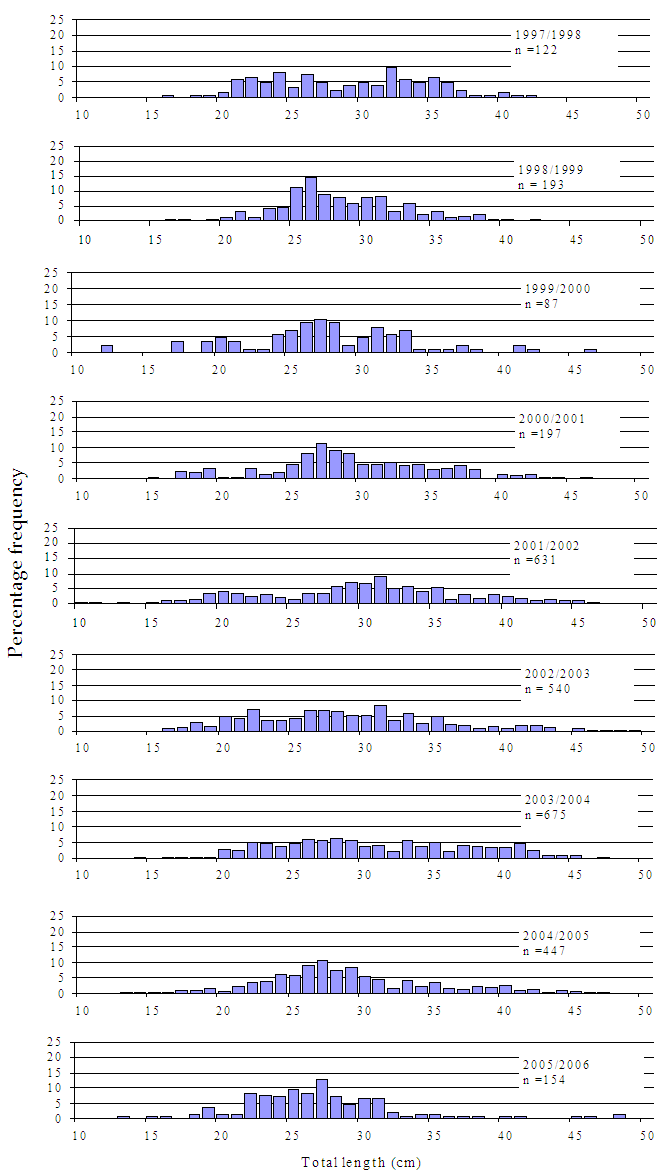
Figure 7. Size composition of black bream caught (retained and released) by diary anglers in the Hopkins River from 1997/98–2005/06 (n = number of fish measured).
BLACK BREAM IN MALLACOOTA INLET
The number of fishing trips reported by diary anglers targeting black bream in the Mallacoota Inlet fluctuated between 12–50 trips for 1997/1998–2000/01, declined to 8 trips in 2001/02, peaked at 88 trips in 2004/05, and declined to 47 trips in 2005/06 (Table 11). The number of anglers contributing to the Program increased from one angler in 1997/98 to 8 anglers in 2004/05. Over the nine-year reporting period, anglers caught over 3400 black bream, of which 51% were released.
Estimated mean total catch rates of black bream (retained and released) from targeted catches in Mallacoota Inlet fluctuated between 2.2 and 3.4 fish per trip from 1998/99 to 2004/05, and increased to 5.8 fish per trip for 2005/06 (Appendix 4 Figure 21).
The size distribution of black bream (retained and released) in the Mallacoota Inlet showed a progression of three size groups/year classes moving through the fishery from 1998/99 to 1999/00, 2000/01 to 2002/03, and 2003/04 to 2004/05 (Figure 8). The average total length of black bream in Mallacoota Inlet was 28 cm, and 62% (n = 2477) of black bream measured were above the LML (26 cm TL).
Table 11 . Summary of fishing effort and black bream catches reported by anglers contributing to the Angler Fishing Diary Program who targeted black bream in Mallacoota Inlet (1997/98–2005/06).
|
Year |
No. anglers |
No. trips |
Angler hours |
No. fish retained |
No. fish released |
|---|---|---|---|---|---|
|
1997/98 |
1 |
26 |
73 |
129 |
74 |
|
1998/99 |
2 |
12 |
33 |
44 |
19 |
|
1999/00 |
3 |
12 |
65 |
37 |
39 |
|
2000/01 |
5 |
50 |
184 |
306 |
409 |
|
2001/02 |
3 |
8 |
18 |
19 |
15 |
|
2002/03 |
5 |
64 |
212 |
277 |
173 |
|
2003/04 |
4 |
36 |
105 |
133 |
159 |
|
2004/05 |
8 |
88 |
377 |
412 |
615 |
|
2005/06 |
6 |
47 |
169 |
320 |
225 |
BLACK BREAM IN LAKE TYERS
Angler diarists targeted black bream in Lake Tyers from 2000/01–2005/06. The number of fishing trips reported by diary anglers targeting black bream in Lake Tyers increased from two trips in 2000/01 to 68 trips in 2002/03, decreased to 38 trips in 2004/05 and increased again to 80 trips in 2005/06 (Table 12). The number of anglers contributing to the Program increased from just one angler in 2000/01 to seven anglers in 2003/04, but has declined to two anglers in 2005/06. Over the six-year reporting period, anglers caught 1677 black bream, 55% of these were released.
Estimated mean total catch rates of black bream (retained and released) from targeted catches in Lake Tyers increased from 2.0 fish per trip in 2000/01 to 3.6 fish per trip in 2001/02, declined to 1.9 fish per trip by 2003/04, and more than doubled to 4.2 fish per trip in 2005/06 (Appendix 4 Figure 22).
The size distribution of black bream (retained and released) in Lake Tyers showed a continuous progression of one size group/year class moving through the fishery from 2000/01 to 2005/06 (Figure 9). Black bream in Lake Tyers ranged from 10 to 44 cm TL, the average length was 24 cm TL, and 23% (n = 1748) of black bream measured were above the LML (26 cm TL).
Table 12. Summary of fishing effort and black bream catches reported by anglers contributing to the Angler Fishing Diary Program who targeted black bream in Lake Tyers (2000/01–2005/06).
|
Year |
No. anglers |
No. trips |
Angler hours |
No. fish retained |
No. fish released |
|---|---|---|---|---|---|
|
2000/01 |
1 |
2 |
7 |
4 |
0 |
|
2001/02 |
3 |
35 |
148 |
122 |
286 |
|
2002/03 |
6 |
68 |
226 |
162 |
399 |
|
2003/04 |
7 |
61 |
164 |
107 |
160 |
|
2004/05 |
3 |
38 |
117 |
93 |
37 |
|
2005/06 |
2 |
80 |
156 |
254 |
53 |
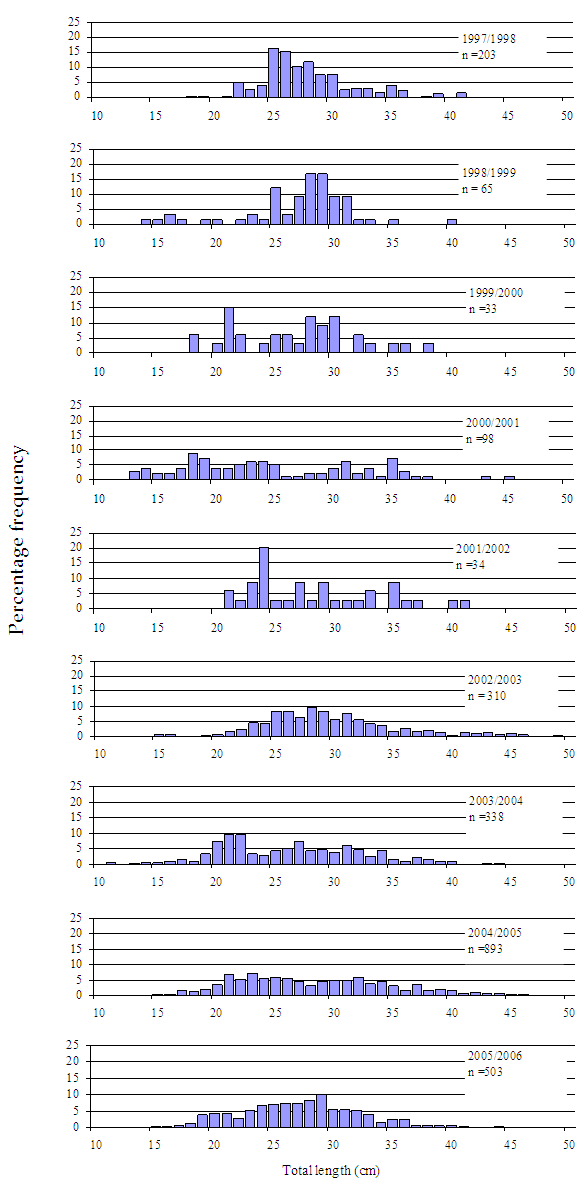
Figure 8. Size composition of black bream caught (retained and released) by diary anglers in the Mallacoota Inlet from 1997/98 to 2005/06 (n = number of fish measured).
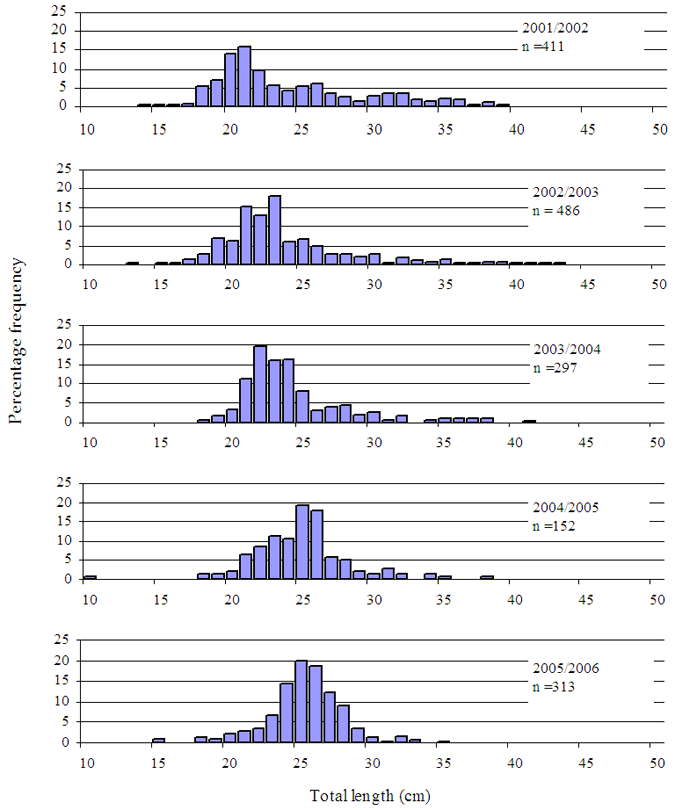
Figure 9. Size composition of black bream caught (retained and released) by diary anglers in Lake Tyers from 2001/02 to 2005/06 (n = number of fish measured).
Sand flathead
Port Phillip Bay was the preferred water body fished by diary anglers targeting sand flathead. The number of fishing trips targeting sand flathead ranged from 3 trips by one angler in 1997/98 to 61 trips by 15 anglers in 2002/03 (Table 13). Annual angler hours increased from 25 hours in 1997/98 to a peak of 543 hours in 2001/02, and then decreased to 431 hours in 2005/06. Anglers caught 6204 sand flathead over the study period, of which 38% were released.
Estimated mean total catch rates of sand flathead (retained and released) targeted by anglers in Port Phillip Bay varied widely between years and ranged from 2.2 to 17.2 fish per trip during the study period (1997/98–2005/06) (Appendix 4, Figure 23).
Sand flathead caught in Port Phillip Bay ranged from 16 to 37 cm TL. The majority of fish were between 25–30cm TL (Figure 10). Sand flathead below the LML (25 cm TL) comprised 13% of the catch.
Table 13. Summary of fishing effort and sand flathead catches reported by anglers contributing to the Angler Fishing Diary Program who targeted sand flathead in Port Phillip Bay (1997/98–2005/06).
|
Year |
No. anglers |
No. trips |
Angler hours |
No. fish retained |
No. fish released |
|---|---|---|---|---|---|
|
1997/98 |
1 |
3 |
25 |
55 |
20 |
|
1998/99 |
2 |
5 |
37 |
66 |
24 |
|
1999/00 |
4 |
11 |
87 |
24 |
46 |
|
2000/01 |
5 |
18 |
138 |
183 |
144 |
|
2001/02 |
7 |
57 |
543 |
1131 |
378 |
|
2002/03 |
15 |
61 |
412 |
1038 |
602 |
|
2003/04 |
11 |
36 |
308 |
423 |
314 |
|
2004/05 |
10 |
20 |
168 |
280 |
181 |
|
2005/06 |
12 |
44 |
431 |
618 |
679 |
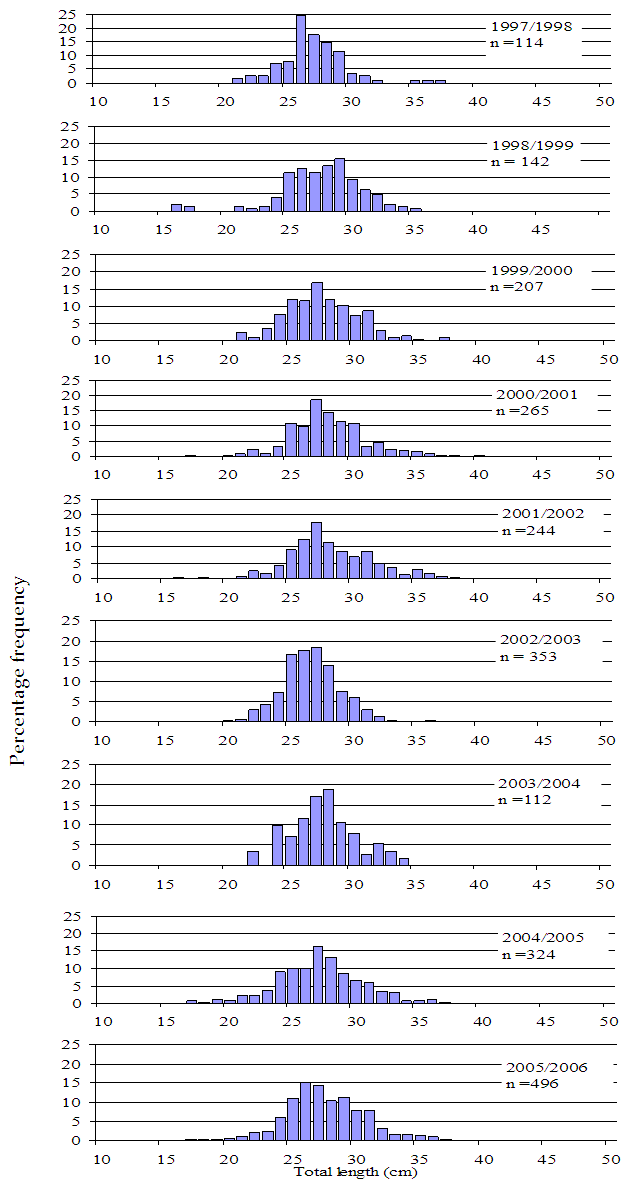
Figure 10. Size composition of sand flathead caught (retained and released) by diary anglers in Port Phillip Bay from 1997/98–2005/06 (n = number of fish measured).
Trout
Trout were targeted by diary anglers in over 14 water bodies around Victoria during 1998/99–2004/05 (Table 14). Trout were not targeted during the 2005/06 season.
The Goulburn River was the water body most fished by anglers targeting trout. During 1998/99–2000/01, 40–49% of annual angler hours were spent targeting trout in the Goulburn River; this declined to between 9–19% for 2001/02–2004/05 (Table 14).
Cairn Curran Reservoir was the next preferred water body during the earlier seasons, but in recent years the effort targeting trout has dispersed more evenly in eight water bodies.
Table 14. Number of angler hours targeting trout, by season and water body, reported by anglers contributing to Angler Fishing Diary Program (1998/99–2004/05).
|
Water body |
1998/99 |
1999/00 |
2000/01 |
Year |
2002/03 |
2003/04 |
2004/05 |
|---|---|---|---|---|---|---|---|
|
Goulburn River |
110 |
626 |
275 |
89 |
289 |
119 |
101 |
|
Cairn Curran Reservoir |
178 |
114 |
172 |
76 |
59 |
57 |
|
|
Lake Fyans |
18 |
38 |
46 |
125 |
41 |
67 |
|
|
Lake Modewarre |
4 |
3 |
101 |
135 |
52 |
8 |
|
|
Delatite River |
42 |
54 |
57 |
68 |
4 |
3 |
|
|
Lake Purrumbete |
16 |
8 |
36 |
229 |
28 |
16 |
|
|
Lake Eildon |
5 |
45 |
33 |
33 |
21 |
63 |
164 |
|
Barkers Creek Reservoir |
74 |
42 |
7 |
2 |
|||
|
Upper Coliban Reservoir |
77 |
29 |
6 |
||||
|
Lake Dartmouth |
22 |
37 |
25 |
24 |
57 |
66 |
|
|
Tullaroop Reservoir |
31 |
86 |
113 |
||||
|
Lake Bullen Merri |
34 |
92 |
85 |
91 |
|||
|
Mount Emu Creek |
5 |
70 |
105 |
||||
|
Other water bodies |
67 |
332 |
126 |
244 |
395 |
327 |
327 |
|
Total |
224 |
1300 |
691 |
999 |
1488 |
1004 |
1120 |
TROUT IN THE GOULBURN RIVER
The number of fishing trips undertaken by diary anglers targeting trout in the Goulburn River ranged from 15 trips by 2 anglers in 1998/99 to 105 trips by 12 anglers in 1999/2000 (Table 15). Annual angler hours fluctuated greatly, ranging between 89 and 626 hours, but the number of fish per hour was remarkably consistent. Over the seven-year period (1998/99–2004/05), anglers caught 1351 trout, 722 brown trout and 629 rainbow trout.
Estimated mean total catch rates of brown and rainbow trout (retained and released) from targeted catches in the Goulburn River fluctuated between 0.6 and 1.6 fish per trip, with wide confidence limits for some years (Appendix 4 Figure 24).
Table 15 . Summary of fishing effort and trout catches reported by anglers contributing to the Angler Fishing Diary Program who targeted trout in the Goulburn River (1998/99–2004/05).
|
Year |
No. anglers |
No. trips |
Angler hours |
No. trout Total |
No. fish |
No. brown |
No. rainbow |
|---|---|---|---|---|---|---|---|
|
1997/98 |
|||||||
|
1998/99 |
2 |
15 |
110 |
104 |
1.4 |
78 |
26 |
|
1999/00* |
12 |
105 |
626 |
459 |
1.4 |
182 |
275 |
|
2000/01 |
6 |
52 |
275 |
193 |
1.4 |
127 |
66 |
|
2001/02* |
3 |
21 |
89 |
105 |
0.8 |
74 |
29 |
|
2002/03 |
4 |
63 |
289 |
256 |
1.1 |
132 |
124 |
|
2003/04 |
6 |
37 |
119 |
138 |
0.9 |
64 |
74 |
|
2004/05 |
4 |
22 |
101 |
96 |
1.0 |
63 |
33 |
Note: not all trout catch were identified by species.
The size distribution of measured trout indicated two size groups of both brown and rainbow trout (Figure 11 and Figure 12). The average length of brown and rainbow trout were 27 and 26 cm TL, respectively. Brown trout catches contained a higher proportion of fish above 30 cm TL (34%) compared with rainbow trout (21%).
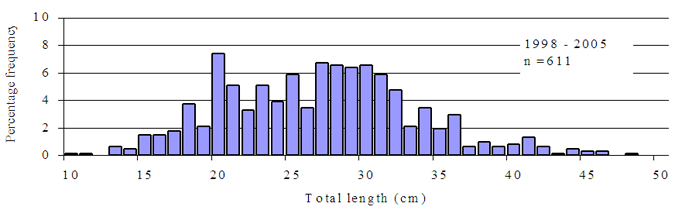
Figure 11. Size composition of brown trout caught (retained and released) by diary anglers in the Goulburn River from 1998/99 to 2004/05 (n = number of fish measured).
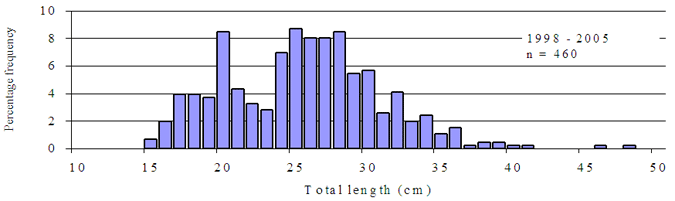
Figure 12. Size composition of rainbow trout caught (retained and released) by diary anglers in the Goulburn River from 1998/99 to 2004/05 (n = number of fish measured).
Golden Perch
The Murray River was the preferred water body fished by anglers targeting golden perch (Table 16). The number of fishing trips targeting golden perch in the Murray River ranged from 9 trips by 5 anglers in 1999/2000 to 48 trips by 11 anglers in 2001/02; 23 trips were undertaken by 6 anglers in 2005/06 (Table 17). Annual angler hours increased from 76 hours in 1999/2000 to a peak of 298 hours in 2001/02, and then declined to 110 hours in 2005/06. Anglers caught 636 golden perch over the study period, 59% of which were released.
Estimated mean total catch rates of golden perch (retained and released) targeted by anglers in the Murray River increased from 0.8 to 4 fish per trip from 1999/2000 to 2000/01 (Appendix 4 Figure 25). Catch rates then fluctuated between 0.7 and 1.6 fish per trip for the remainder of the study period (1999/00–2005/06).
Table 16. Number of angler hours targeting golden perch, by season and water body, reported by anglers contributing to Angler Fishing Diary Program (1998/99–2004/05).
|
Water body |
1998/99 |
1999/00 |
2000/01 |
Year |
2002/03 |
2003/04 |
2004/05 |
2005/06 |
|---|---|---|---|---|---|---|---|---|
|
Murray River |
76 |
82 |
298 |
277 |
237 |
201 |
110 |
|
|
Cairn Curran Reservoir |
21 |
13 |
22 |
8 |
20 |
12 |
||
|
Avoca River |
29 |
56 |
39 |
12 |
1 |
|||
|
Lake Eppalock |
25 |
121 |
175 |
89 |
45 |
123 |
230 |
38 |
|
Goulburn River |
23 |
31 |
74 |
92 |
81 |
38 |
||
|
Campaspe River |
8 |
11 |
20 |
9 |
13 |
8 |
30 |
10 |
|
Edwards River |
59 |
15 |
71 |
21 |
14 |
|||
|
Lake Mokoan |
24 |
40 |
17 |
34 |
31 |
7 |
||
|
Lake Mulwala |
24 |
16 |
11 |
56 |
25 |
15 |
||
|
Loddon River |
88 |
40 |
40 |
33 |
28 |
31 |
26 |
5 |
|
Ovens River |
62 |
37 |
43 |
8 |
||||
|
Richardson River |
4 |
10 |
31 |
39 |
11 |
29 |
||
|
Lake Eildon |
5 |
4 |
6 |
11 |
12 |
22 |
||
|
Other water bodies |
0 |
58 |
46 |
15 |
77 |
57 |
98 |
20 |
|
Total |
121 |
446 |
522 |
637 |
754 |
753 |
752 |
299 |
Table 17. Summary of fishing effort and golden perch catches reported by anglers contributing to the Angler Fishing Diary Program who targeted golden perch in the Murray River (1999/2000–2005/06).
|
Year |
No. anglers |
No. trips |
Angler hours |
No. fish retained |
No. fish released |
|---|---|---|---|---|---|
|
1999/00 |
5 |
9 |
76 |
7 |
21 |
|
2000/01 |
8 |
13 |
82 |
59 |
87 |
|
2001/02 |
11 |
48 |
298 |
49 |
59 |
|
2002/03 |
9 |
46 |
277 |
51 |
50 |
|
2003/04 |
7 |
39 |
237 |
37 |
45 |
|
2004/05 |
8 |
26 |
201 |
38 |
37 |
|
2005/06 |
6 |
23 |
110 |
23 |
73 |
The size distribution of golden perch indicates two size groups, with a peak at 27 cm TL (Figure 13). The average length for golden perch was 36 cm TL, 55% (710) of fish measured were above the LML (30 cm TL).
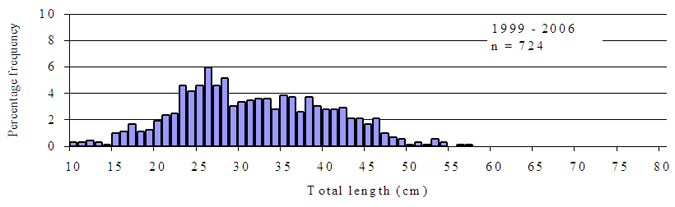
Figure 13. Size composition of golden perch caught (retained and released) by diary anglers in the Murray River from 1999/2000 to 2005/06 (n = number of fish measured).
Murray Cod
The Murray River was the preferred water body fished by diary anglers targeting Murray cod (Table 18). The number of fishing trips targeting Murray cod in the Murray River ranged from 11 trips by 5 anglers in 1999/00 to 81 trips by 15 anglers in 2002/03, before decreasing to 34 trips by 6 anglers in 2005/06 (Table 19). Annual angler hours increased from 85 hours in 1999/2000 to a peak of 527 hours in 2002/03, and then decreased to 166 hours in 2005/06. Anglers caught 721 Murray cod over the study period (1999/00–2005/06), of which 84% were released.
Estimated mean total catch rates of Murray cod (retained and released) targeted by anglers in the Murray River fluctuated between 0.18 and 0.47 fish per trip between 2000/01 and 2005/06 (Appendix 4, Figure 26).
Table 18. Number of angler hours targeting Murray cod, by season and water body, reported by anglers contributing to Angler Fishing Diary Program (1998/99–2004/05).
|
Water body |
1998/99 |
1999/00 |
2000/01 |
Year |
2002/03 |
2003/04 |
2004/05 |
2005/06 |
|---|---|---|---|---|---|---|---|---|
|
Murray River |
85 |
137 |
346 |
524 |
423 |
254 |
166 |
|
|
Goulburn River |
18 |
28 |
36 |
41 |
62 |
5 |
||
|
Campaspe River |
3 |
11 |
6 |
9 |
||||
|
Edwards River |
41 |
15 |
61 |
13 |
||||
|
Lake Mulwala |
104 |
112 |
56 |
176 |
139 |
43 |
2 |
|
|
Loddon River |
87 |
21 |
10 |
22 |
18 |
26 |
20 |
6 |
|
Ovens River |
58 |
46 |
10 |
13 |
4 |
|||
|
Other water bodies |
0 |
78 |
15 |
26 |
85 |
39 |
41 |
121 |
|
Total |
90 |
357 |
338 |
525 |
873 |
742 |
437 |
300 |
Table 19. Summary of fishing effort and Murray cod catches reported by anglers contributing to the Angler Fishing Diary Program who targeted Murray cod in the Murray River (1999/2000–2005/06).
|
Year |
No. anglers |
No. trips |
Angler hours |
No. fish retained |
No. fish released |
|---|---|---|---|---|---|
|
1999/00 |
5 |
11 |
85 |
0 |
33 |
|
2000/01 |
10 |
22 |
137 |
8 |
73 |
|
2001/02 |
11 |
60 |
346 |
31 |
127 |
|
2002/03 |
15 |
81 |
527 |
28 |
171 |
|
2003/04 |
15 |
64 |
423 |
32 |
94 |
|
2004/05 |
10 |
31 |
254 |
8 |
47 |
|
2005/06 |
6 |
34 |
166 |
9 |
60 |
Murray cod caught in the Murray River ranged from 12 to 78 cm TL with a mode at 46 cm TL (Figure 14). The average length was 43 cm TL, 24% (n=760) of Murray cod were above the LML (50 cm TL). Few Murray cod were above 60 cm TL.
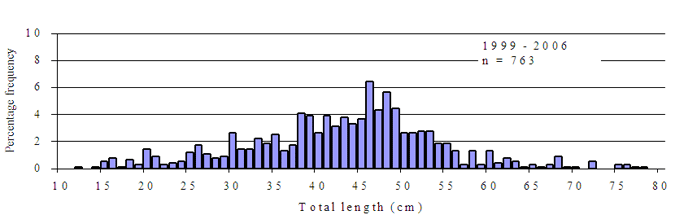
Figure 14. Size composition of Murray cod caught (retained and released) by diary anglers in the Murray River from 1999/2000 to 2005/06 (n = number of fish measured).
Follow up Survey
A total of 83 follow up surveys were conducted with anglers following the completion of their fishing diaries. The follow up surveys covered a total of 1537 angler trips of which 1003 (65%) were for a nominated main fishery and included 14 different species and 36 separate water bodies. Zero catches made up 108 (11%) fishing trips (Table 20).
The follow up surveys identified an additional 170 non-reported trips of which 60 (35%) were zero catches. The proportion of zero catches in non reported catches varied with nominated species from 0 % (flathead, King George whiting and Murray cod) to 100% (Trout). Zero catches made up the majority (73%) of non-reported trips by anglers who had fished in freshwater. Zero catches made up 22% of non-reported trips by anglers who had fished in marine/estuarine waters (Table 20).
Table 20 . A comparison of zero catches for reported and non reported fishing trips undertaken by anglers contributing to the Angler Fishing Diary Program from follow up surveys (2004–2006).
|
Species |
No. of |
No. of zero (%) reported catch trips |
No. of non reported trips |
No. of non reported zero catch trips |
|---|---|---|---|---|
|
Black bream |
227 |
6 (3%) |
19 |
7 (37%) |
|
Flathead (all) |
47 |
0 (0%) |
30 |
0 (0%) |
|
Snapper |
290 |
21 (7%) |
66 |
15 (23%) |
|
King George whiting |
77 |
17 (22%) |
0 |
0 |
|
Other |
73 |
8 (11%) |
10 |
5 (50%)) |
|
Marine/ estuarine all |
714 |
52 (7%) |
125 |
27 (22%) |
|
Murray cod |
59 |
5 (8 %) |
0 |
0 |
|
Golden Perch |
61 |
10 (16%) |
30 |
18 (60%) |
|
Trout (all) |
112 |
33 (29%) |
15 |
15 (100%) |
|
Other |
57 |
8 (14 %) |
0 |
0 |
|
Freshwater all |
289 |
56 (19%) |
45 |
33 (45%) |
|
Total |
1003 |
108 (11%) |
170 |
60 (35%) |
Collection of ageing samples
Diary anglers collected 5460 otoliths during 1999/2000–2005/06 required for ageing studies as part of other fisheries research projects (Table 21). Otoliths were collected from five species:
- Black bream (n=3897)
- King George whiting (n=368)
- Snapper (n=464)
- Dusky flathead (Platycephalus fuscus) (n=396)
- Estuary perch (Macquaria colonorum) (n=335).
Table 21 . Summary of otoliths and spines collected by anglers contributing to the Angler Fishing Diary Program (1999/2000–2005/06).
|
Year |
Black bream |
King George whiting |
Snapper |
Dusky flathead |
Estuary perch |
|---|---|---|---|---|---|
|
1999/00 |
43 |
||||
|
2000/01 |
11 |
8 |
5 |
||
|
2001/02 |
4 |
147 |
330 |
||
|
2002/03 |
550 |
84 |
68 |
119 |
|
|
2003/04 |
1615 |
94 |
377 |
110 |
|
|
2004/05 |
975 |
75 |
13 |
12 |
|
|
2005/06 |
703 |
115 |
2 |
Discussion
Rational and acceptable fishery management requires the establishment of reliable data sources. The Angler Fishing Diary Program provided summary assessment data for eight recreationally important fish species in eight separate water bodies. The time period, range of species and water bodies covered in this study demonstrates the capability of a group of dedicated anglers to provide catch information for fish population assessment purposes.
There was a generally increasing trend over nine years in the number of anglers contributing and the number of trips reported (Table 1). This indicates a commitment by recreational anglers to contribute to the sustainability of their fisheries. A decline in these two parameters in the last two years suggests that continued efforts are needed to recruit and retain anglers in the Program.
Continued efforts are needed to improve the management of the Program, increase the quality and quantity of feedback to anglers and other interested groups, and decrease the time for analysis, interpretation and reporting.
Information on fish stocks in key marine fisheries
There were more reports from marine fisheries than freshwater fisheries (Figure 1). This reflects the greater popularity of marine fishing sites, the monitoring activities outlined by fisheries management plans, and the availability of anglers willing to take part in the Program.
The results for snapper in Port Phillip Bay highlight the value of the diary program. The analysis of the size of fish caught enables managers to follow the progression of cohorts of fish over time. Evidence of four abundant snapper spawning seasons in Port Phillip Bay over the reporting period (1997/98–2005/06) (Figures 2 and 15) is reliably verified by annual larval surveys in Port Phillip Bay, and subsequent ageing of these cohorts after they recruited to the fishery (DPI 2008).
Snapper catch rates in Port Phillip Bay are likely to remain high due to sustained high levels of recruitment. Similar catch rate trends for larger snapper in Western Port bay suggest monitoring this species is useful when assessing fish stocks. Changes in catch rate trends could alert managers to changes in fish recruitment or to changes in angler behaviour.
Snapper caught in Port Phillip Bay were generally under the LML, whereas snapper caught in Western Port bay were almost all over the LML. This may indicate possible differences in habitat requirements for different life stages.
Angler effort for snapper in Western Port bay was less focused than in Port Phillip Bay, and only one spawning season (2002/03) was evident (Figure 3).
Catch rates for King Gorge whiting were relatively stable over nine years (Figures 17 and 18) and provides a useful indicator of the impact of changes in patterns of larval abundance.
Settlement of post-larval King George whiting in Port Phillip Bay has been monitored since 1996 and can be used to predict peaks in catches 2–4 years after settlement. Previous reports have suggested the majority of King George whiting caught by recreational anglers in Port Phillip Bay are 2+ and 3+ year old with some 1+ and 4+ year old fish (DPI 2008). Given there are few year classes in the fishery at any time, catches and abundance of whiting may vary greatly from year to year dependant on year class strength. High abundances of King George whiting larvae were recorded in 1997 and 2001 (DPI 2008).
The limited representation of undersize King George whiting in angler catches (Figures 4 and 5), suggests that larval monitoring is the most suitable method for predicting changes to this fishery. Strong larval settlement detected in 2005 is expected to result in higher catch rates of whiting by anglers in Port Phillip Bay in 2008 and 2009 (DPI 2008).
King George whiting in Western Port bay were targeted and retained more frequently than in Port Phillip Bay due to their larger size and prevalence. King George whiting 4+ in age are rarely caught in Port Phillip Bay (DPI unpublished data).
The results for black bream in the Gippsland Lakes and other water bodies show similar trends to those for snapper in that they show a pattern of regular more abundant year classes recruiting to the fisheries (Tables 9-12 and Figures 6-9). Evidence of variable stock recruitment patterns for a number of bream fisheries adds weight to the contention that the Angler Fishing Diary Program is a valuable asset in fisheries management.
Catch information from the Angler Fishing Diary Program is currently the only tool used to monitor the status of black bream stocks in Mallacoota Inlet, Lake Tyers and the Hopkins River, where commercial fishing is not permitted. The time series of catch rate and size composition information presented in this report indicates that the abundance of black bream stocks are in a fluctuating but stable state (Figures 6-9, 19-22).
A declining trend in black bream catch rates in the Gippsland Lakes from 1998/99 to 2002/03, is consistent with a gap of several years since the last abundant bream year-class in 1995 (Morrison and Conron 2009). Higher catch rates and the size compositions of catches reported by anglers in 2003/04 to 2005/06 indicate a slight increase in the overall abundance of bream below the LML (Figures 6 and 19).
Fluctuations in sand flathead catch rates reported by anglers fishing in Port Phillip Bay are not consistent with a decline in abundance recorded as part of a trawl monitoring program (Figure 23). The Port Phillip Bay Annual Trawl Sub-Program has been conducted by the Department of Primary Industries almost annually since 1990. A decline in sand flathead abundance has been recorded since 1991. The decline appears to be partly driven by recruitment failure, particularly since 2000 (Parry et al. 2009).
Sand flathead is often recorded as a secondary target species by anglers fishing for snapper or King George whiting. The catchability of sand flathead may be more variable for anglers who are fishing primarily for a different species. Further training of anglers to distinguish between sand and yank flathead (Platycephalus speculator) (a species not in decline) may improve the accuracy of sand flathead catch reporting by anglers.
Potential of the Angler Fishing Diary Program to provide performance indicators for freshwater fisheries
In the freshwater fisheries, around 500 fishing trips were reported each year (Figure 1). This provides an initial base for monitoring freshwater fish stocks.
Increased numbers of anglers need to be recruited to the diary program to improve the reliability of freshwater data for fish stock assessment purposes.
For trout species, total angler hours fluctuated but remained around 1000 in the last four years of the Program (Table 14). The number of fish caught per hour of fishing effort in the Goulburn River was consistent over seven years (Table 15). Changes in this parameter over time could reflect changes in fisher skill or in availability of trout. Trout were not targeted during the 2005/06 season due to a low priorities in terms of both data needs by Fisheries Victoria, and the species preferences of the anglers participating in the Program.
Brown and rainbow trout size compositions (Figures 11 and 12) showed two modes around 20 cm and 27-29 cm. This was consistent with results from electrofishing surveys in the Goulburn River during 1997 – 2000 (Brown 2008). The significance of this can only be clarified by further work, but it may be possible to forecast the strength of the fishery by following size cohorts over time.
Catch data from the Goulburn River for brown and rainbow trout, and from the Murray River for golden perch, showed no clear trends in abundance (Figures 24 and 25). This was partly due to the low number of fishing trips reported.
The total numbers of golden perch caught per hour of fishing effort (Table 17) were consistent except for two years (2002/02 and 2005/06). Again, changes in certain years are difficult to interpret without more information about climate, habitat and fisher skill.
Catch rates for Murray cod were lower than any of the other seven species in this report. Size composition data was limited, making recruitment patterns difficult to determine.
The willingness of diary anglers to assist in the collection of ageing samples is a reflection of their interest in fisheries research and their motivation to participate in the Angler Fishing Diary Program.
There is some uncertainty about whether the catch rate and size composition data produced by anglers accurately represents the overall abundance and population structure of target species in the fishery being sampled. Catches by the most experienced anglers are strongly influenced by fishing gear, habitat and environmental conditions, as well as fluctuations in stock abundance. As with traditional fishery independent methods the fishing gear used by diary anglers and the timing of sampling periods should be carefully considered if data are to be used to assess fish stocks.
The Angler Fishing Diary Program, like other self reporting methods of collecting catch and effort data, have been shown to be prone to biases resulting from non-reporting of catches (Oehmcke et al. 1986; Pollock et al. 1994). The diary follow up survey conducted as part of this study also identified a potential source of bias in relation to non-reporting of zero catches.
Non-reporting of zero catches may be a data quality issue, particularly if the prevalence varies from year to year. This bias, along with those associated with accurately recording catch and effort information, can be minimised by clear instruction on how and why information should be recorded in a particular way and by providing regular feedback to participating anglers.
Regular assessments of non-reported catches will provide information relating to potential impacts on stock status indicators and allow adjustments to be made where necessary.
Information to encourage continued involvement of recreational fishers in the monitoring of their recreational fisheries.
The Angler Fishing Diary Program proved popular and the diaries were, in general, well kept. Annual data collection in this way is clearly feasible. It is the least expensive way of monitoring recreational fisheries. The wealth of information collected has been and will continue to be forwarded to participants through newsletters and stock assessment meetings, and more widely through magazines, press releases, and the internet.
The following data sets and their interpretation will be of particular interest to anglers and fisheries managers, and will be used to encourage continued monitoring of the fisheries:
- Number of anglers submitting diaries
- Number of fishing trips in different fisheries
- Numbers of fish caught per hour of effort
- Release rates and the reasons behind these
- Cohorts moving through the fisheries over time and their potential predictive value with respect to the status of the stocks.
Angler participation and enthusiasm can also be improved and encouraged through regular contact, the diary follow up survey and the review of data during stock assessments.
Conclusion
The development of the Angler Fishing Diary Program in Victoria has provided valuable data concerning fish stock performance indicators for key marine fisheries (snapper, King George whiting, black bream and sand flathead) by providing a time series of catch rates and size composition information from a large group of highly skilled and motivated anglers. These data can improve the accuracy and precision of fish stock performance indicators for key marine species.
The Angler Fishing Diary Program provides estimates of pre-recruits, identifies strong year classes and allows for the population to be tracked over time, as pre-recruits and as they progress through the fishery.
There is continued involvement of recreational fishers in the monitoring of their recreational fisheries. High coverage has been achieved in the major water bodies of Victoria. Catch information from the Angler Fishing Diary Program is currently the only tool used to monitor the status of black bream stocks in the minor Victorian water bodies.
Catch rates of targeted freshwater species (trout, golden perch and Murray cod) were lower than those of targeted marine species. Recruiting more freshwater anglers would provide a better opportunity to determine the suitability of an Angler Fishing Diary Program for monitoring freshwater fish stocks.
This study has shown that not all fish stocks will benefit from angler diary programs. It has also indicated that this is only one of several monitoring techniques which should be considered for stock assessments. An important bias was found to be non-reporting of zero catch trips by anglers and while this can be minimised, the impact this bias has on stock assessment indicators should be regularly reviewed.
The Angler Fishing Diary Program is an example of a cost-effective approach to providing fisheries managers with fish stock assessment advice.
Acknowledgements
We would like to thank the following organisations and persons:
This project is funded by the Victorian Government using Recreational Fishing Licence fees (Project No. 5/03/04/R) to run the Angler Fishing Diary Program in 2004/05 and to report on the information collected to 2005/06.
The Victorian Recreational Fishing Peak Body (VRFISH) for funding the expansion of the Program 1998/99; and Fisheries Victoria for funding support for the Program each year since.
The many anglers who contributed to the Program:
Michael Agius, Sue Agnew, Gordon Ahchow, Marc Ainsworth, Ray Airs, Ross Albiston, John Alsop, Dale Amy, Graeme Anderson, Bob Anthony, Michael Armitage, Norm Armstrong, Nick Atyeo, Peter Atyeo, Jim Bailey, Jodie Baillie, Peter Ball, Lyn Barr, Lynton Barr, Terry Bastin, Tony Batchelor, Remy Baya, Justin Bell, Keith Bell, Stephen Booth, Andrew Both, Howard Bott, Eric Box, Ken Bradley, Glenda Brain, Sean Brodie, Tony Brothers, Ron Bull, Wayne Bull, Rod Burge, Stephen Burton, Kevin Cahill, Micheal Carlsson, Lindsay Carroll, Robert Carruthers, Ian Carstairs, Arthur Carvill, Tony Cassidy, Greg Cheetham, Chris Chipperfield, Alan Chisholm, Chris Christou, Steve Church, Gary Claridge, Don Collins, John Coon, Peter Cornish, Peter Costa, Peter Coulton, Shane Cutajar, David Davies, Paul Davis, Travis Dawson, Jim Day, Wally De Lange, Mark Dean, David Debrincat, Daniel Deppeler, Brian Dicker, Robert Dimmack, Danny Divova, Ralph Doddrell, Michael Duke, Mick Dwyer, Kevin Dyson, Ken Edlington, Tim Edwards, Gerald Egan, Richard Emmerson, Adrian Feher, Brian Fervolio, Colin Finkemeyer, Peter Galloway, Chris Garnar, Chris Garner, Barry Geary, Allan Gee, Mal George, Peter Gifford, Russell Giles, Mike Gleeson, Pat Gleeson, Judy Glen, Ray Goding, Don Goodman, Mal Gough, Ken Graves, Neville Gray, Scott Gray, Keiran Hall, Alan Hamilton, Ralph Hamilton, Frank Harris, John Harrison, Richard Hawkins, Robin and Elaine Herbert, Roy Hetherington, Derek Hichisson, Barry Hicks, Greg Hicks, Ernie Hill, Brett Hoare, Carl Hodgkins, John Hoffman, Bruce Holding, Brendan Howard, Don Howe, Henry Humphrys, Colin Hurford, Stuart Irvine, Ian Jenkins, Peter Jewell, John Johnstone, Ian Jones, Gary Jude, Michael Kincad, Mike Kirwin, Jon Kollen, Mario Kovacic, Robert Krix, Jason Lamb, Jack Lawson, Sing Ling, Allan Litt, Robert Loats, Ray Long, Tom MacCormack, Andrew Maguire, Colin Marshall, Russell Martin, R Mason, Bryan Matthews, Ted Maxfield, Michael McBrien, Sue McCracken, Alistair McGlashan, Eain McRae, Graeme Merryful, Garry Middleton, Marjie Millen, Gerard Miller, Ken Millican, Joe Montalti, John Morgan, B Mullavey, John Murray, Wally Myrwoda, Paul Neaves, David Needham, Barry Norris, Peter Nyikos, Bob O'Connell, David Oates, Leo Okely, Nick Papadopoulos, Damian Park, Russell Patterson, Keith Patton, Bob Pearce, Ken Pearson, Gavin Perkins, Craig Perrott, David Pickering, John Pincombe, David Pisani, Chris Polson, Ted Potter, Mark Proctor, Ann Przybysz, Tom Purcell, John Quinn, Ken Radley, Tony Ramunno, Lee Rayner, John Reid, Joseph Restall, Frank Richards, Conway Robinson, Allan Rogers, Paul Said, Michael Sanders, Gary Scanlan, John Schmidt, Robert Schroader, Dave Scrase, Tim Sculley, Damon Sherriff, Joe Singe, Graham Siostrom, Bruce Smith, David Smith, Luke Smith, Dennis Sorby, Anthony Spiteri, Tony Spiteri, Ian Sprigg, Bob Stapley, Michael Stephens, Russ Stewart, Alexander Stone, Trevor Stow, Ray Stratton, Robert Strong, Kevern Sutton, John Teeuws, John Telford, Alby Thomas, Brian Thomas, Matthew Urzia, Tony Van Kempen, Rob Van Ryn, Imants Vasils, Fergie Ward, Walter Waruszynki, John Webb, Don Welsford, Doug Whitford, John Whitford, Noel Wickson, Jeff Willey, Kevin Willey, Kevin Williams, Colin Wilson, Fred Wilson, Matthew Wilson, Ross Winstanley, Gordon Wise, Lockie Wombell, John Wood, Russell Wright and David Young.
Robyn Cameron-Smith undertook the telephone contact component of the project and her efforts are greatly appreciated. The many hours of data entry cheerfully undertaken by Pam Oliveiro is also greatly appreciated. We would like to thank Masaaki Machida who constructed and maintained the databases. David McKeown, Ian Duckworth, Daniel Grixti, Mike Kirwin, Di Crookes and Sean Brodie have also been important contributors to the day to day running of the Program over the years.
Professor David Galloway and Thérèse Stokie reviewed this report, and provided many helpful editorial comments.
References
Brown, P. (2008) Goulburn River Trout Fishery: Monitoring and Assessment. Fisheries Victoria Research Report Series No. 20.
Conron, S., (2003). Recreational Management controls of commercially important species. FRDC Final Report 97/146, Primary Industries Research Victoria, Queenscliff, Victoria
Conron, S., and Bridge, N. (2004). 'Voluntary Angler Diary Program in Victoria 1997–2003.' Marine and Freshwater Systems Internal Report, Queenscliff.
Conron, S., Ward, M., Grixti, D., Bridge, N. and Stokie, T.K. (2010). Monitoring estuarine fish stocks in Anderson Inlet, Mallacoota Inlet and the Glenelg and Hopkins Rivers.
Fisheries Revenue Allocation Committee Final Report. DPI, Victoria.
Department of Primary Industries (2008). Fishery Status Report 2008. Fisheries Management Report Series No 63, Melbourne.
Efron, B., Tibshirani, R.J., (1993). 'An Introduction to the Bootstrap.' (Chapman and Hall: New York)
Jones, C.M., Robson, D.S., Lakkis H.D., Kressel J. (1995). Properties of catch rates used in analysis of angler surveys. Transactions of the American Fisheries Society 124, 911-928.
Morrison, A.K. and Conron, S. (eds)(2009). Black Bream 2001. Compiled by the Bays and Inlets Stock and Fishery Assessment Group. Fisheries Victoria Internal Report Series No. 12.
Oehmcke, A.A., Addis, J.T., Mooradian, S.R., Ogden, K., and Stange, D. (1986). The role of anglers and private organizations in muskellunge management. In: angler survey methods and their applications in fisheries management. Vol 24, American Fisheries Society, Special Publication, Bethesda 323-334.
Parry, G.D., Werner, G.G, White, C.A, Hirst, A.J., Heislers, S., and Walker, T.I, (2009) Port Phillip Bay Annual Trawl Sub-Program Milestone Report No. 2 (2009). Fisheries Victoria Technical Report Series No. 54, August 2009. Department of Primary Industries, Queenscliff, Victoria, Australia. 43 pp.
Pollock, K.H., Jones, C.M., and Brown, T.L. (1994). Logbooks, diaries, catch cards. In: Anglers survey methods and their applications in fishery management, Vol 25 American Fisheries Society, Special Publication, Bethesda 309-315.
Appendix 1
Appendix 2
Appendix 3
Snapper in Port Phillip Bay
Figure 15 Estimated mean total catch rate (± 95% confidence limits) of snapper targeted by anglers in Port Phillip Bay (1998/99–2005/06).
Snapper in Western Port bay
Figure 16. Estimated mean total catch rate (± 95% confidence limits) of snapper targeted by anglers in Western Port bay (1998/99–2005/06).
King George whiting in Port Phillip Bay
Figure 17. Estimated mean total catch rate (± 95% confidence limits) of King George whiting targeted by anglers in Port Phillip Bay (1998/99–2005/06).
King George whiting in Western Port bay
Figure 18. Estimated mean total catch rate (± 95% confidence limits) of King George whiting targeted by anglers in Western Port bay (1998/99–2005/06).
Black bream in the Gippsland Lakes
Figure 19. Estimated mean total catch rate (± 95% confidence limits) of black bream targeted by anglers in the Gippsland Lakes (1998/99–2005/06).
Black bream in the Hopkins River
Figure 20. Estimated mean total catch rate (± 95%confidence limits) of black bream targeted by anglers in the Hopkins River (1998/99–2005/06).
Black bream in Mallacoota Inlet
Figure 21. Estimated total catch rate (± 95% confidence limits) of black bream targeted by anglers in Mallacoota Inlet (1998/99–2005/06).
Black bream in Lake Tyers
Figure 22. Estimated mean total catch rate (± 95% confidence limits) of black bream targeted by anglers in Lake Tyers (2000/01–2005/06).
Sand flathead in Port Phillip Bay
Figure 23. Estimated mean total catch rate (± 95% confidence limits) of sand flathead targeted by anglers in Port Phillip Bay (1997/98–2005/06).
Trout in the Goulburn River
Figure 24. Estimated mean total catch rate (± 95% confidence limits ) of trout (brown and rainbow) targeted by diary anglers in the Goulburn River (1998/99–2004/05).
Golden perch in the Murray River
Figure 25. Estimated mean total catch rate (± 95% confidence limits) of golden perch targeted by anglers in the Murray River (1999/2000–2005/06).
Murray cod in the Murray River
Figure 26. Estimated mean total catch rate (± 95% confidence limits) of Murray cod targeted by anglers in the Murray River (1999/2000–2004/05).