Movement of golden perch and Murray cod in the Nagambie Lakes System
![]()
Funded by: Recreational Fishing Licence Trust
Submitted by: Arthur Rylah Institute for Environmental Research
Produced by: Tom Ryan and Justin O'Mahony
Produced for Fisheries Victoria
Funded by the Recreational Fishing Licence Trust
Contact Robert Krix
JANUARY 2005
Table of Contents
Acknowledgments
Summary
Introduction
Background Information
Methods
Radio tracking logger stations
Radio Tag Implantation Procedure
Tagged and released fish
Other monitoring and activities
Results
Introduced Murray Cod
Translocated Golden Perch
Downstream movement
Upstream movement
Riverine Golden Perch
Physical Conditions
Habitat Utilisation
Food Availability
Discussion
Introduced Murray cod
Translocated Golden Perch
Riverine Golden Perch
Physical Conditions
Fish Habitat Related Issues
Recommendations to fisheries managers of the NLS
References
Acknowledgments
The authors wish to thank a number of people that have contributed throughout the project. Steve Hall and David Francis (GMW) provided access to the compounds on the outlet structures at Goulburn Weir and permission to install the radio tracking logging stations. David Larter (Woodlawn Park) and Robert Wills (Noorilim Estate) provided access to the pumping shed and power to maintain battery. We are also grateful for local information received from Steve Hall and David Francis (GMW) and Wally Cubbin and Fred Bloetz (Nagambie Angling Club). A number of people assisted with field work on the project including Justin O'Connor, Jarod Lyon, Jason Lieschke, Steve Saddlier, Peter Stapleton, Ruth Lennie, Dave Crook, Peter Fairbrother, Damien O'Mahony, Zeb Tonkin and Terry Glenane. Justin O'Connor provided expert assistance and instruction with fish surgeries. Barbara Dworakowski (Theiss Environmental Services) was as ever reliable with flow information requests and Steve Hall (GMW) also provided water release information. Additional thanks to Pat Feehan (GMW) and Micheal Lake (SKM) for providing temperature information at other locations including Chinamans Bridge and Goulburn Weir. Thanks to Damien O'Mahony, David Crook and Gary Backhouse for assistance in designing, applying and obtaining funding. Funding for the project was provided from revenue from the Recreational Fishing Licence Trust Account (Fisheries Victoria). Comments on the draft of this report were gratefully received from Tim Doeg, Pat Feehan, David Crook and Justin O'Connor.
Summary
The Nagambie Lakes System (NLS), operated primarily as a regulation storage, has the potential to be one of the most popular recreational fishing venues in Victoria. A total of 11 native and six exotic fish and at least four crustacean species have been previously recorded in the NLS. Three native species, including silver perch, Murray cod and predominantly golden perch, have been stocked within the NLS from 1979 to 1994. However, sustainable recreational fish stocks have failed to establish in this system of 1,130 hectares (at full supply), despite the apparent good quality of water and habitat throughout. The objectives of this project were therefore to assess some of the reasons for the failure of these fisheries in the NLS by tracking the movement of two large recreation fish species (golden perch and Murray cod). Fifteen golden perch captured from the Goulburn River downstream of the NLS and 32 hatchery reared Murray cod were implanted with radio transmitters and released at three different locations near the centre of the NLS. With the use of five strategically placed continuous logging stations and monthly manual tracking field trips, the movement of these fish were assessed in terms of habitat utilisation and direction of movement.
Mortality was high for the radiotagged Murray cod released into the NLS, indicating a potentially high predation rate or a failure of these fish to acclimatise to conditions in the NLS. However, the general movement pattern demonstrated a close association to the main channel of flow running south to north through the NLS and the comparative sedentary habit of these fish.
The NLS contains some deep water areas (>10 m) within the original river channel, however, large areas of backwater habitat remain relatively shallow (generally 1-2 m deep). Golden perch and Murray cod demonstrated a strong association with water depth and large instream structures and a reluctance to move into the shallow backwater habitat.
The radiotagged golden perch translocated into the NLS exhibited a highly mobile habit, with half approaching the irrigation outlets on a number of occasions, presumably in an attempt to move downstream. Three fish passed downstream through the outlet gates (1 through the East Goulburn Main and 2 through the Stuart-Murray Canal). This success rate corresponds with previously reported downstream passage success (O'Connor et al. 2003) and demonstrates that fish are able to negotiate passage downstream out of the NLS. Despite high patronage no fish were willing to pass through the Cattanach Canal outlet. In contrast to the downstream movements, 5 golden perch made upstream movements to Chinamans Bridge and beyond in the later part of the study period. These upstream movements appeared to correspond with periods of sustained warmer temperatures (≥20 oC) and large riverine flow pulses (5,000 to >8,000 ML/day).
In addition to the fish released into the lake a further 13 golden perch were captured, implanted with radio transmitters and released in the river below the Goulburn Weir. These fish acted as controls for the golden perch translocated into the NLS while also provided an assessment of movement patterns in the Goulburn River. These fish demonstrated a relatively small home range during base flow conditions (~250 ML/day) and a strong opportunistic movement habit with flushes of >900 to 2,000 ML/day. One of the radio tagged golden perch travelled approximately 12 km upstream to the Goulburn Weir during a spring flush. This event demonstrates that a fish lift on Goulburn weir could be successful, however the priority for fishway construction would need to be weighed up against other rehabilitation measures for the NLS and this section of the catchment.
Evidence collected by this project and from other sources indicates that the greatest influence on water quality (particularly temperature) in the NLS is the large volume of water entering the system. This influence is more evident during the warmer months when large volumes of cooler irrigation water enter the system. As a result the reproductive development and spawning success of warmwater fish are likely to be compromised.
The key findings of this research highlight a number of research priorities and management considerations that support and expand on previous recommendations made for the NLS. The main aim of these priorities are listed below with the intention to maximise the potential to develop selfsustaining recreational fish populations in the NLS:
Research Priorities
- Assess the interaction between fish habitat requirements, including water depth, large instream structures and loss of fish due to terrestrial predators within the NLS
- Assess the suitability of backwater habitat for larval fish (including primary and secondary ecological production) and explore the rehabilitation options and potential impacts
- By firstly conducting additional comparisons on the three irrigation outlets in NLS, explore the potential to increase reluctance of fish to approach the outlet structures (eg. increased turbulence, vibration, shading)
- Additional water quality and sediment monitoring should be conducted (including additional backwater sites) to ensure suitable water quality is being maintained within and being released from the NLS
Management Considerations
- Assess the suitability of fish screens for the three irrigation outlets to prevent the downstream passage of fish
- Consider sourcing stocked fish from cold water acclimatised brood stock
- Where possible limit stocking activities to warmer months
- Stocking of fish 150 to 200 mm in the warmer months (preferably spring) would be advantageous to enable the exploitation of prey items available (small fish and invertebrates) and reduce the impacts of terrestrial predation
- Explore the possibility of providing additional connectivity of the main channel and backwater habitat with use of flood flows, on-ground works to improve strategic flow manipulation and prevent sedimentation of backwater habitat
- Explore the potential to vary water levels in the NLS to reflect the variability and seasonality of natural conditions in an attempt to improve conditions for desirable flora and fauna species (including key recreational fish species) while also disadvantaging exotic pest species
- Increase riverine releases from Goulburn Weir to ensure the base flow conditions provide additional access and habitat and be varied to include greater frequency of spring/summer flushes of at least 2000 ML/day to ensure the inundation of backwater habitat including shallow red gum stands
- Where possible incoming water into the NLS should be managed to prevent rapid temperature fluctuations in spring and summer
Introduction
The Nagambie Lakes System (NLS), being just 125 km north of Melbourne, has the potential to provide a regular recreational fishing venue for hundreds of thousands anglers. However, despite the apparent good water and habitat quality, and the vast quantity of water, sustainable recreational fish stocks have failed to establish. Since the early 1980's popular fishing stocks previously found in the NLS, including redfin (Perca fluviatilis) and golden perch (Macquaria ambigua) have declined. Early indications suggested a decline in the freshwater spiny crayfish (Euastacus armatus) in the NLS however recent indications suggest a recovery (McGuckin 2002, SKM 2002). The Goulburn-Eildon Regional Fisheries Management Plan (Fisheries Victoria 2002) identified the need to assess the status of fisheries in the NLS and to address some of the unresolved questions regarding the demise of the fishery despite extensive fish stocking (particularly golden perch) up to 1994. Previous surveys have suggested the decline of other less abundant species including Murray cod (Maccullochella peelii peelii), river blackfish (Gadopsis marmaratus) and freshwater catfish (Tandanus tandanus).
The cause of these declines may be due to migration, inappropriate management practices, unsuitable environmental conditions, high rates of natural or anthropological mortality and deteriorating ecological health. The objectives of this project were to assess some of these potential influences by tracking the movement of two large recreation fish species (golden perch and Murray cod) introduced into the NLS for one irrigation season.
Large numbers of golden perch, Murray cod and trout cod (Maccullochella macquariensis) occur downstream of Goulburn Weir. As a 'Heritage River' (from Lake Eildon to River Murray (SKM 2002)), the installation of a fish ladder on Goulburn Weir has been recommended as beneficial (DNRE 1997). The need to assess the effectiveness of a fish ladder at Goulburn Weir was recommended by Fisheries Victoria (2002). This project will also provide an indication of the likely behavioural patterns of golden perch, an assessment of the potential success of the fish ladder and indicate potentially limiting factors on the success of native fish populations in the Goulburn River downstream of Goulburn Weir.
Background Information
Including large releases from Lake Eildon other natural inflows into Goulburn River above Nagambie Lakes include the Rubicon, Acheron, Murrindindi, and Yea rivers below Lake Eildon and other smaller streams such as the King Parrot, Sunday, Sugarloaf, Mollison, Majors, Home, Whiteheads and Hughes creeks (Chappell 1997).
The NLS is a shallow storage of 25,000 ML covering an area of 1,130 ha. The NLS acts as a regulation storage for irrigation to Shepparton, Central Goulburn and Rochester (East Goulburn Main Channel) and other towns and irrigation districts via the Waranga Basin (Stuart Murray and Cattanach canals) (Chappell 1997). Some deep water areas of over 10 m depth occur within the original river channel, however, large backwaters including Huttons, Richards Flats, Lake Nagambie and Burramurra are generally only 1-2 m deep. As such there has been little evidence of temperature or salinity stratification (Zampatti et al. 1996, McGuckin 2002, Swingler and Lake 2003). Regulation gates are installed at all outlets to the lower Goulburn River and at irrigation channels. Water levels in the NLS is maintained at full supply for the irrigation season (nominally August 15 to May 15), however, water levels are generally maintained at lower levels during the winter period, primarily to allow the capture of winter run-off. Additionally, water is released to the lower Goulburn River with a minimal environmental release of 250 ML/day. This stream water is also utilised by a number of licensed irrigators and some townships further downstream (with additional supplementation from the Broken River at Shepparton).
A total of 11 native fish have been previously recorded in the NLS. These are silver perch (Bidyanus bidyanus), hardyhead (Craterocephalus sp.), river blackfish, flat-headed galaxias (Galaxias rostratus), golden perch, Murray cod, Murray rainbowfish (Melanotaenia fluviatilis), flat-headed gudgeon (Philypnodon grandiceps), carp gudgeon (Hypseleotris sp.), Australian smelt (Retropina semoni) and freshwater catfish (McGuckin 2002). Two other species, trout cod and Macquarie perch (Macquaria australasica), occurred in this section of the Goulburn River when the weir was constructed, as were naturally occurring populations of Murray cod and freshwater catfish (Brumley et al. 1987). Additionally crustacean species including the large freshwater spiny crayfish and other smaller species such as the shrimp (Paratya australiensis), yabbie (Cherax destructor) and freshwater prawn (Macrobrachium australiense) are also found in the NLS.
Three native species have been stocked within the NLS. The Nagambie Angling Club stocked 38,000 golden perch, 5,000 silver perch and 2,000 Murray cod fingerlings between 1979 and 1986, while Fisheries Victoria stocked 400,000 golden perch fingerlings between 1986 and 1994 (Fisheries Victoria 2002). There have been no stockings since 1994, however, it may be appropriate that stocking could be reintroduced after ensuring that the fish will survive and remain within the NLS.
There are six exotic fish species that have been recorded in the NLS; redfin, goldfish (Carassius auratus), European carp (Cyprinus carpio), brown trout (Salmo trutta), tench (Tinca tinca) and eastern gambusia (Gambusia holbrooki). There is also an abundance of long-necked turtles (Chelodina longicollis), broad shelled turtles (Chelodina expansa), water rats (Hydromys chryogaster) and platypus (Ornithorhynchus anatinus). Short-necked turtles (Emydura macquarii) have also been observed within the NLS (McGuckin 2002).
The management of the NLS primarily as a regulation storage for irrigation at times appears to conflict with the aquatic condition of the NLS and include some of the following potential impacts:
- increased sedimentation in the backwater environments
- increased growth of aquatic pest plant species at the detriment of more beneficial species
- potential impacts of flow constriction control techniques (such as dredging, water level manipulation and chemical control)
- elimination of upstream recruitment of aquatic species
- reduced water quality and habitat heterogeneity, and diversion of most of the water supply (and potentially other biological components such as fish) away from the lower river.
Numerous investigations and management plans have been developed in an attempt to address some of these potential impacts, and many of them have recommended that the movement patterns and habitat requirements of native fish be further investigated (Piani 1998, NRE 2001, McGuckin 2002, Fisheries Victoria 2002, SKM 2002). Other relevant reports and investigations will be discussed in context with the results from this study later in this report.
Methods
The objectives of this project were therefore to assess some of the reasons for the failure of these fisheries in the NLS by tracking the movement of two large recreation fish species (golden perch and Murray cod). Golden perch captured from the Goulburn River downstream and hatchery reared Murray cod were implanted with radio transmitters and released at three different locations near the centre of the NLS. With the use of five strategically placed continuous logging stations and monthly tracking field trips, the movement of these fish were assessed in terms of habitat utilisation, movement patterns within and attempts to move upstream or downstream out of the NLS. Additionally, golden perch were caught, implanted with radio transmitters and re-released in the river below the Goulburn Weir. These fish provided the control for the golden perch translocated into the NLS and also provided an assessment of limiting factors on native fish populations in the Goulburn River.
Radio tracking logger stations
Radio tracking logger stations were installed at 5 strategic locations in early July 2003 in preparation for the releases of radio tagged fish (Figure 1). These logging stations were located upstream of the Nagambie Lakes near Chinamans Bridge, on the East Goulburn Main Channel (EGMC) outlet, the Cattanach
Channel (CC) outlet, the Stuart Murray Channel (SMC) outlet, and downstream in the Goulburn River at Noorilim. Loggers were enclosed within large metal boxes and connected to electronic modems to allow direct communication from ARI. Power supply to maintain battery charge was supplied at each location.
Two antennas were used in four of the five loggers, one orientated upstream and the other downstream from the Nagambie Lakes, which resulted in an ability to detect radio tagged fish moving towards the loggers and record movement downstream on the second antenna. Three antenna were used at the logger
on Goulburn Weir, an upstream logger (into the lake), downstream in the Stuart Murray Channel and downstream in the Goulburn River. This orientation resulted in the ability to detect fish moving toward the weir from the lake, potentially track the fish moving downstream in the Stuart Murray Channel and
detect radio tagged fish going over the weir or moving upstream from the Cable Hole. Each logger automatically recorded fish movements within 300 m in each antenna direction and was downloaded approximately every 2-4 weeks (see Appendix A for more specific details).
Figure 1: Location map of fish logging sites and main places of interest in the Nagambie Lakes System.
Figure shows the Nagambie Lakes System and the relative location of the signage (red circles), fish location loggers (green circles) and temperature loggers (red triangles). The location of the downstream logger (ie. at the top of this diagram given a northerly direction of flow) is approximately 12 km downstream on the Goulburn River at Noorilim.
Radio Tag Implantation Procedure
Fish were held in a large (1000 L) aerated portable fish holding tank prior to tagging and acclimatised to water collected from the release location at a rate of (5 L min-1). Tag implantation was performed using veterinarian and AEEC procedures as conducted by O'Connor et al. (2003) and were conducted under the requirements of ethics approval permit (AEC 02/010).
Fish were anaesthetised in a holding bin with 0.75 ml of the anaesthetic Alfaxan per 10 litres of water collected from the release location. A further 50 % diluted anaesthetic solution was prepared to ensure fish remained anaesthetised during the procedure. This solution was run directly over the gills of the fish if the fish become agitated. Time in the anaesthetic varied with temperature, but generally was around 5 minutes. Gill movement was monitored to assess the state of fish consciousness. Slow and erratic (ie. fluttering) gill movement indicated the fish was anaesthetised. Pinching the pectoral fins was used as a further test of fish consciousness.
Fish were held in a V-shaped holding frame that was padded with protective foam during the tagging procedure (O'Connor et al. 2003). The foam was covered with a sheet of cheesecloth, which had previously been soaked in Betadine© disinfectant to minimise infection. The risk of infection was also minimised by the use of rubber gloves by personnel involved in the tagging procedure, swabbing all incisions made during the procedure with Betadine© and placing all utensils into a tray with 100 ml of Betadine© (O'Connor et al. 2003).
Each fish was weighed (to the nearest g) and measured (to the nearest mm) after removal from the anaesthetic, before being placed into the V-shaped holding frame. The transmitter (ATS manufactured, 150 MHz, pulse-coded internal radio transmitters) was then inserted into the abdomen of the fish via a 2 cm incision extending from the pectoral fin toward the anus. The aerial was passed out through the lateral body wall of the fish, posterior to the incision. A hypodermic needle was pushed through the lateral wall and the aerial was then threaded through the needle, which was then removed. When the transmitter and aerial were in position the incision was closed with two internal and three external sutures. The fish weights (measured prior to fitting the radio transmitters) were assessed to ensure the final weight did not exceed 1.5% the original body weight to ensure buoyancy was not compromised (Lucas and Baras 2000). External identification of individual fish was achieved from inserting green Tbar tags between the second and third dorsal spines. These tags provided an individual number, the address details of the ARI and a toll free phone number for reporting tag recaptures. Each fish was treated with an antibiotic (Baytril© 50) before being placed into the recovery salt bath. The antibiotic was injected into the dorsal muscle of the fish at a dose rate of 0.1 ml/kg. Fish then recovered in a disinfectant salt bath (500g / 40 litres of river water) for 20 minutes then moved back into the large aerated transportable fish tank. This tank was moved to each of the releases sites and fish moved from the tank to the lake via large plastic drums. Surgeries on radio-tagged fish on the Goulburn River below the NLS were conducted on site and therefore fish were placed in holding cages in the river prior to being released in the vicinity of the Cable Hole.
Radio Tag Implantation Procedure
Fish were held in a large (1000 L) aerated portable fish holding tank prior to tagging and acclimatised to water collected from the release location at a rate of (5 L min-1). Tag implantation was performed using veterinarian and AEEC procedures as conducted by O'Connor et al. (2003) and were conducted under the requirements of ethics approval permit (AEC 02/010).
Fish were anaesthetised in a holding bin with 0.75 ml of the anaesthetic Alfaxan per 10 litres of water collected from the release location. A further 50 % diluted anaesthetic solution was prepared to ensure fish remained anaesthetised during the procedure. This solution was run directly over the gills of the fish if the fish become agitated. Time in the anaesthetic varied with temperature, but generally was around 5 minutes. Gill movement was monitored to assess the state of fish consciousness. Slow and erratic (ie. fluttering) gill movement indicated the fish was anaesthetised. Pinching the pectoral fins was used as a further test of fish consciousness.
Fish were held in a V-shaped holding frame that was padded with protective foam during the tagging procedure (O'Connor et al. 2003). The foam was covered with a sheet of cheesecloth, which had previously been soaked in Betadine© disinfectant to minimise infection. The risk of infection was also minimised by the use of rubber gloves by personnel involved in the tagging procedure, swabbing all incisions made during the procedure with Betadine© and placing all utensils into a tray with 100 ml of Betadine© (O'Connor et al. 2003).
Each fish was weighed (to the nearest g) and measured (to the nearest mm) after removal from the anaesthetic, before being placed into the V-shaped holding frame. The transmitter (ATS manufactured, 150 MHz, pulse-coded internal radio transmitters) was then inserted into the abdomen of the fish via a 2 cm incision extending from the pectoral fin toward the anus. The aerial was passed out through the lateral body wall of the fish, posterior to the incision. A hypodermic needle was pushed through the lateral wall and the aerial was then threaded through the needle, which was then removed. When the transmitter and aerial were in position the incision was closed with two internal and three external sutures. The fish weights (measured prior to fitting the radio transmitters) were assessed to ensure the final weight did not exceed 1.5% the original body weight to ensure buoyancy was not compromised (Lucas and Baras 2000). External identification of individual fish was achieved from inserting green Tbar tags between the second and third dorsal spines. These tags provided an individual number, the address details of the ARI and a toll free phone number for reporting tag recaptures.
Each fish was treated with an antibiotic (Baytril© 50) before being placed into the recovery salt bath. The antibiotic was injected into the dorsal muscle of the fish at a dose rate of 0.1 ml/kg. Fish then recovered in a disinfectant salt bath (500g / 40 litres of river water) for 20 minutes then moved back into the large aerated transportable fish tank. This tank was moved to each of the releases sites and fish moved from the tank to the lake via large plastic drums. Surgeries on radio-tagged fish on the Goulburn River below the NLS were conducted on site and therefore fish were placed in holding cages in the river prior to being released in the vicinity of the Cable Hole.
Table 1: Summary information of radio-tagged Murray cod translocated into Nagambie Lakes
System.
| Date | Length (mm) | Weight (g) |
Radio Tag (Freq/Code) | Tag Size |
T-bar ID Tag # | Surgeon | Release Site |
|---|---|---|---|---|---|---|---|
| 23/07/03 | 372 | 812 | 21414 | sml | 9612 | J O'C | Kirwins Bridge |
| 22/07/03 | 370 | 806 | 21418 | sml | 11556 | J O'C | Bazleys Island |
| 22/07/03 | 365 | 839 | 21419 | sml | 11570 | J O'C | Kirwins Bridge |
| 22/07/03 | 381 | 751 | 21419 | sml | G11558 | J O'M | Bazleys Island |
| 22/07/03 | 366 | 817 | 23419 | sml | 11555 | J O'M | Picnic Point |
| 23/07/03 | 400 | 853 | 25314 | med | 11554 | J O'C | Picnic Point |
| 23/07/03 | 397 | 844 | 25315 | med | 9604 | J O'M | Bazleys Island |
| 23/07/03 | 385 | 860 | 25316 | med | 9609 | J O'M | Picnic Point |
| 22/07/03 | 403 | 880 | 25318 | sml | 11557 | J O'M | Kirwins Bridge |
| 22/07/03 | 356 | 636 | 25319 | sml | 11559 | J O'M | Kirwins Bridge |
| 23/07/03 | 405 | 964 | 27313 | med | 11553 | J O'C | Picnic Point |
| 23/07/03 | 370 | 790 | 27315 | med | 9607 | J O'C | Bazleys Island |
| 23/07/03 | 380 | 815 | 27316 | med | 9610 | J O'M | Kirwins Bridge |
| 22/07/03 | 373 | 799 | 27318 | sml | 11560 | J O'C | Bazleys Island |
| 22/07/03 | 372 | 779 | 27319 | sml | 11562 | J O'C | Picnic Point |
| 23/07/03 | 415 | 985 | 29412 | med | 11552 | J O'C | Kirwins Bridge |
| 23/07/03 | 405 | 950 | 29415 | med | 9606 | J O'C | Bazleys Island |
| 22/07/03 | 405 | 867 | 29418 | sml | 11561 | J O'C | Picnic Point |
| 22/07/03 | 380 | 865 | 29419 | sml | 11563 | J O'M | Kirwins Bridge |
| 23/07/03 | 372 | 895 | 31212 | med | 9603 | J O'M | Bazleys Island |
| 23/07/03 | 397 | 880 | 31214 | med | 9611 | J O'M | Kirwins Bridge |
| 23/07/03 | 384 | 992 | 31216 | med | 11551 | J O'M | Picnic Point |
| 22/07/03 | 325 | 642 | 31218 | sml | 11569 | J O'C | Kirwins Bridge |
| 22/07/03 | 355 | 743 | 31219 | sml | 11566 | J O'M | Bazleys Island |
| 23/07/03 | 400 | 860 | 33414 | med | 9608 | J O'C | Bazleys Island |
| 23/07/03 | 375 | 927 | 33415 | med | 9601 | J O'M | Picnic Point |
| 23/07/03 | 414 | 1000 | 33416 | med | 9605 | J O'M | Bazleys Island |
| 22/07/03 | 390 | 812 | 33418 | sml | 11568 | J O'C | Picnic Point |
| 22/07/03 | 381 | 875 | 33419 | sml | 11565 | J O'M | Bazleys Island |
| 23/07/03 | 389 | 847 | 35416 | med | 9602 | J O'M | Picnic Point |
| 22/07/03 | 380 | 885 | 35418 | sml | 11567 | J O'C | Picnic Point |
| 22/07/03 | 390 | 863 | 35419 | sml | 11564 | J O'M | Kirwins Bridge |
| Information provided includes date of capture and release; length and weight prior to surgery, frequency, code and relative size of radio transmitter implanted; identification of the green T-bar tag; initials of surgeons; and capture and release location of each fish. | |||||||
Table 2: Summary information of radio-tagged golden perch translocated into Nagambie Lakes
System.
| Date |
Length (mm) |
Weight (g) |
Radio Tag (Freq/Code) | Tag Size |
T-bar ID Tag # | Surgeon | Capture Site | Release Site |
|---|---|---|---|---|---|---|---|---|
| 5/08/03 | 475 | 1761 | 23415 | Large | 9623 | J O'C | Barambah | Kirwins Bridge |
| 5/08/03 | 410 | 1222 | 29417 | Med | 9622 | Jarod L | Barambah | Picnic Point |
| 5/08/03 | 427 | 1235 | 31215 | Med | 9620 | T R | Barambah | Picnic Point |
| 5/08/03 | 423 | 1068 | 33413 | Med | 9619 | J O'C | Barambah | Picnic Point |
| 5/08/03 | 447 | 1339 | 25317 | Med | 9625 | T R | Noorilim | Kirwins Bridge |
| 5/08/03 | 400 | 950 | 27317 | Med | 9624 | T R | Noorilim | Picnic Point |
| 5/08/03 | 430 | 1346 | 35414 | Med | 9617 | J O'C | Noorilim | Picnic Point |
| 5/08/03 | 425 | 1128 | 35417 | Med | 9627 | Jarod L | Noorilim | Kirwins Bridge |
| 5/08/03 | 397 | 846 | 25312 | Med | 9637 | Jarod L | Barambah | Bazleys Island |
| 7/08/03 | 431 | 1197 | 27312 | Med | 9636 | T R | Barambah | Bazleys Island |
| 7/08/03 | 438 | 1172 | 29413 | Med | 9631 | T R | Barambah | Bazleys Island |
| 7/08/03 | 412 | 1062 | 29414 | Med | 9635 | T R | Barambah | Kirwins Bridge |
| 7/08/03 | 455 | 1332 | 31217 | Med | 9634 | D C | Barambah | Bazleys Island |
| 7/08/03 | 400 | 908 | 33417 | Med | 9633 | P F | Barambah | Bazleys Island |
| 7/08/03 | 431 | 1225 | 35415 | Med | 9632 | T R | Barambah | Bazleys Island |
Table 3: Summary information of radio-tagged golden perch in the Goulburn River below
Goulburn Weir.
| Date |
Length (mm) |
Weight (g) |
Radio Tag (Freq/Code) | Tag Size |
T-bar ID Tag # | Surgeon | Capture Site | Release Site |
|---|---|---|---|---|---|---|---|---|
| 13/08/03 | 430 | 1238 | 31213 | med | 9648 | J O'M | d/s Cable Hole | d/s Cable Hole |
| 13/08/03 | 492 | 2079 | 21416 | large | 9649 | J O'M | d/s Cable Hole | d/s Cable Hole |
| 13/08/03 | 409 | 1128 | 29416 | med | 9650 | T R | d/s Cable Hole | d/s Cable Hole |
| 13/08/03 | 515 | 2272 | 23416 | large | 9700 | T R | d/s Cable Hole | d/s Cable Hole |
| 13/08/03 | 422 | 1183 | 33412 | med | 9699 | J O'M | d/s Cable Hole | d/s Cable Hole |
| 13/08/03 | 390 | 860 | 25313 | med | 9698 | J O'M | d/s Cable Hole | d/s Cable Hole |
| 13/08/03 | 402 | 1193 | 27314 | med | 9697 | J O'M | u/s Cable Hole | u/s Cable Hole |
| 13/08/03 | 445 | 1583 | 21413 | large | 9696 | T R | u/s Cable Hole | u/s Cable Hole |
| 13/08/03 | 434 | 1170 | 35413 | med | 9694 | T R | u/s Cable Hole | u/s Cable Hole |
| 10/09/03 | 433 | 1360 | 23413 | large | 14176 | T R | d/s Cable Hole | u/s Cable Hole |
| 10/09/03 | 478 | 1630 | 21415 | large | 14175 | S S | d/s Cable Hole | u/s Cable Hole |
| 10/09/03 | 427 | 1360 | 21417 | large | 14178 | T R | d/s Cable Hole | u/s Cable Hole |
| 10/09/03 | 415 | 1270 | 23417 | large | 14181 | T R | u/s Cable Hole | u/s Cable Hole |
Other monitoring and activities
Continuous temperature loggers were deployed at a number of locations around the NLS. Monthly water quality was recorded using a TPS FL90 water quality meter, and measured conductivity, temperature, dissolved oxygen and pH.
There have been eight tracking surveys conducted monthly since the fish were deployed. Each fish was tracked once by boat using an ATS manufactured radio receiver, at approximately 4 weekly intervals and at a single spot location recorded their distance from last recorded location. Habitat characteristics (depth, location, type of habitat and habitat density) at the fish location were recorded. Community awareness of the project was facilitated by visual displays and media releases. Educational signs were displayed at Picnic Point boat ramp, McNamara Point boat ramp and at Goulburn Weir (fence adjacent the GMW office) from October 22 to the completion of the project. The location of these signs is shown in Figure 1 and the sign design is provided in Appendix 2. The activities of the project were advertised in the print media including Fish-Fax, Seymour Advertiser, Seymour Telegraph, Euroa Gazette, Shepparton News and the local Kyabram and Numurkah newspapers. Additionally fliers for the project were posted in the shire offices in Nagambie and Euroa as well as in a number of businesses in the district. These activities ensured local anglers and visitors were aware of the project and would return tagged fish to the river and report capture details to project staff.
Results
Introduced Murray Cod
Two days after the release of the Murray cod (24 July 2003), most fish were located in the vicinity of their release locations, however one had been capture by a pelican, which was located in the backwater near Bazleys Island. The transmitter from this fish was later located beneath a large tree stump, adjacent to the river channel, 2 km downstream from Picnic Point.
After three weeks (August 14) eight fish, including the one taken by the pelican, were recorded with mortality signals (triggered by 8 hours continuous inactivity). Four fish were not found, however, twenty were recorded with an active signal within 500 m upstream or downstream from their release locations (Figure 2).
After eight weeks (September 16), 10 of these fish were not found and the number of fish transmitting mortality signals had risen to 11, indicating a mortality rate of 34 % (Figure 2). Again none of the remaining 11 fish had moved further than 500m from their release locations.
After 13 weeks (October 23), three fish were not found and the number of fish recorded with a mortality signals had increased to 15 (Figure 2). One of the dead fish was previously recorded alive at Picnic Movement of golden perch and Murray cod in the Nagambie Lakes System 11
Point 3 weeks after release but was now observed with a mortality signal in the Nagambie Weir Pool, 1.5 km upstream of the EGM outlet. While most fish had remained within 500m of the release site, it is likely that this fish had been captured (possible by a pelican) and the transmitter rejected 6.5 km downstream, beneath the large tree stump.
All fish were accounted for after 16 weeks (November 13). The number with mortality signals increased to 21 and the number recorded with active signals was 11 (Figure 2), giving an unusually high mortality rate of 66%. After 20 weeks (December 15), there were 15 fish missing due to the expiration of the batteries within the small transmitters (Figure 2). Six of the 15 expired transmitters were in fish that were recorded alive one and two months earlier.
All fish were accounted for after 26 weeks (January 22). There were 17 fish with expired transmitter batteries, 13 with mortality signals and two transmitting active signals (Figure 2). The remaining two alive fish (#31212 and #31214) were found in the vicinity of their released locations. One of these
(#31212) had remained around Bazleys Island for the entire study. The other (#31214) had made an upstream movement from the release location at Kirwins Bridge to Picnic Point sometime between July 24 and August 14 2003, a distance of approximately 1 km. It was subsequently found at 13 weeks after release
only 300 m downstream from Kirwins Bridge, where it remained for the remainder of the study.
Figure 2: Summary of Murray cod tracked in the Nagambie Lakes System.
Data includes transmitting active signals in the NLS (solid line), fish recorded on mortality (dashed line), fish not found (black columns) and fish that had transmitters with expired batteries (stripped columns).
Translocated Golden Perch
There were three fish recorded with mortality signals (33 %) in October and five in December from an initial release of 15 radio-tagged golden perch on August 7 2003 (Figure 3). A large number of fish were missing in September (4 out of 15), however, increased tracking efforts in subsequent months
resulted in a greater number of fish being found. By January 2004, three of the remaining 10 fish had exited the NLS downstream via the irrigation outlets and by late April 2004 (and May 2004) five fish had been detected moving upstream above Chinamans bridge (Figure 9).
Figure 3: Summary of the number of golden perch tracked in the Nagambie Lakes System. Data includes fish recorded on mortality (dashed line), fish not found (black columns), fish exiting NLS downstream (white columns) and fish exiting NLS upstream (stippled columns).
DOWNSTREAM MOVEMENT
Most of radio tagged fish had moved from their release locations after 1 week (August 14) with both upstream and downstream movements of up to 2,100 m and an average of 540 m. Golden perch in the NLS continued to be relatively mobile with an average distance moved of 1270 m after nine weeks. One fish
(#31217) was located near the East Goulburn Main outlet (EGM), a distance of 8,600 m, during a period of no irrigation release. Another fish (#31217), appeared to be assessing its options to move downstream over the month. It was recorded upstream of the Goulburn Weir (GW) (14,000m downstream from upstream
logger) and at the Cattanach Canal (CC) (13,000m downstream from upstream logger) between October 8 and 14 (Figure 4). This fish subsequently moved back to the EGM and passed downstream on October 17 around 2 pm (Figure 4, Figure 5). At the time of passing, the EGM gate opening was 840 and 800 mm on
the 16 and 17 October respectively with a release discharge of 1,235 ML/ day (Figure 5, indicated by red arrow). This fish was then tracked 4.5 km downstream in the EGM canal on October 22 and subsequently disappeared outside the range of this investigation.
Figure 4: Recorded movement of golden perch #31217
Figure includes location relative to the upstream logger indicated by discontinuously linked 'X' marks. Points of reference include Picnic Point at 6,000 m, Kirwins Bridge at 7,000 m, Bazleys Island at 8,500 m, Cattanach Canal at 13,000 m, Goulburn Weir and Stuart Murray Canal outlet at 14,000 m, East Goulburn Main outlet at 15,000 m. Distances greater than 15,000 m indicating fish located in irrigation canals downstream from the NLS.
Two other golden perch (#29414 and #33417) migrated downstream to the southern end of the NLS and were active in late September and October, the later being the most active fish during the study. Fish # 33417 was observed between October 4 and 10 at all three irrigation outlets; EGM, GW (adjacent to the Stuart Murray Canal SMC) and CC (Figure 6). It was subsequently observed in a backwater between Kirwins Bridge and Picnic Point on October 22. This fish appeared to continue this nomadic movement pattern between all three irrigation outlets and the river section between Picnic Point and Bazleys Island, including the small backwater, immediately adjacent to the Nagambie Angling Club (Figure 6). Logger recordings and tracking observations indicated this fish travelled at least 127 km between August 8, 2003 and April 14, 2004. It was, however, unwilling to pass through any of the irrigation outlets, despite approaching gate openings of 1,150 mm at EGM, 800 mm at SMC and 830 mm at the CC.
There were another five golden perch (bringing the total to eight) that also undertook large-scale movements to investigate the possibility of downstream migration from the NLS (#23415, #25312, #27312, #31215, #35417). Two of these fish passed downstream through the SMC gates. One of these fish (#35417),
was tracked at Kirwins Bridge on September 16, passed downstream through the SMC gates on November 30 at approximately 6 pm at a gate opening of only 350 mm (Figure 7). It was detected on the other two loggers on November 30 and December 1, indicating the fish was high in the water column within the
SMC and emitting a strong signal. The other fish (#23415), initially tracked 600 m upstream of Picnic Point on November 13, passed through the SMC gates on December 20 Passed downstream through the EGM (Figure 6) at approximately 12 noon at a gate opening of 480 mm (Figure 7) and was then recorded on
the CC logger (at a gate opening of 900 mm). These fish were not tracked downstream in the SMC.
Figure 5: Golden perch approaches to the East Goulburn Main outlet and corresponding gate height opening and outlet discharge.
Figure provides three main pieces of information, including approaches of golden perch to outlet structure (light blue vertical bars) together with time of fish passage through the outlet structure (red arrow), outlet discharge (dark blue line) and height of gate opening (red line).
The CC outlet structure was approached by six different fish at gate opening from 100 to 900 mm. Three fish approached on October 8 (#29414, #31217 and #33417) and two fish on October 9 (#29414 and #31217) (Figure 8). Fish #33417 approached the gates on 12 different occasions (Figure 8). Despite this
high patronage all fish were unwilling to pass through the CC outlet which will be discussed later.
Figure 6: Recorded movement of golden perch #33417
Figure includes location relative to the upstream logger indicated by discontinuously linked 'X' marks. Points of reference include Picnic Point at 6000m, Kirwins Bridge at 7,000 m, Bazleys Island at 8,500 m, Cattanach Canal at 13,000 m, Goulburn Weir and Stuart Murray Canal outlet at 14,00 0m, East
Goulburn Main outlet at 15,000 m. Distances greater than 15000m indicating fish located in irrigation
canals downstream from the NLS.
Figure 7: Golden perch approaches to the Stuart-Murray Canal outlet and corresponding gate height opening and outlet discharge.
Figure provides three main pieces of information, including approaches of golden perch to outlet structure (light blue vertical bars) together with times of fish passage through the outlet structure (red arrows), outlet discharge (dark blue line) and height of gate opening (red line).
Figure 8: Golden perch approaches to the Cattanach outlet and corresponding gate height opening and outlet discharge.
Figure provides three main pieces of information, including approaches of golden perch to outlet structure (light blue vertical bars), outlet discharge (dark blue line) and height of gate opening (red line).
UPSTREAM MOVEMENT
Later in the season, five golden perch trvelled upstream in the vicinity of the upstream logger near Chinamans Bridge. Three of these fish had also been recorded on the loggers downstream on the irrigation outlets. The upstream movement corresponded to warmer temperature (recorded at Chinamans Bridge by SKM) and relatively higher discharges at Seymour (Figure 9). The first fish to move upstream was recorded on January 21 (fish #31215). On November 11, this fish had been recorded at the loggers on Goulburn Weir and the Cattanach Canal, a month later (December 15) it was tracked at Picnic Point. This corresponded to a period of warmer water temperatures with average daily water temperatures at Chinamans Bridge of just below 20 oC and an increasing discharge at Seymour. This fish then spent the remaining four months in this upstream section of river, being tracked up to 1,200 m upstream and 3,000 m downstream from the logger at Chinamans Bridge.
The second fish (#25312) was released at Bazleys Island on August 7 2003 but was consistently moving upstream. It was tracked at Picnic Point on September 11 2003, 300 m upstream of Picnic Point on December 15 and then on the upstream logger on March 22 2004 (Figure 9). This upstream migration corresponded with a peak in average daily discharge at Seymour in excess of 8,000 ML/day and warmer average daily temperatures greater than 18 oC (Figure 9). It then spent until at least April 2 in this section of the river, but was tracked just 400 m upstream of Picnic Point on April 14 2004 and was subsequently recorded on the loggers at Goulburn Weir and Cattanach Canal from 6 to March 7 2004. After a initial relatively inactive period of five months, the third fish (#27312) commenced large scale upstream movements. On January 6 it was recorded on the downstream loggers at Goulburn Weir and the EGM. It remained in this section of the lake, moving between the SMC and the EGM outlets presumably attempting to find a suitable passage downstream until February 10 2004. Gate openings at the time were between 500 and 650 mm at SMC and variable at the ECM with one gate being opened up to 960 mm at times and three gates being opened simultaneously between 300 and 500 mm. It was subsequently tracked to 400 m downstream from Kirwins Bridge in its original location on January 14 then from February 26 onwards it moved to section of river upstream of Chinamans Bridge (Figure 9). The timing of this upstream movement corresponded with a peak in average daily discharge at Seymour in excess of 8,000 ML/day on February 22 and warmer average daily temperatures of 20 oC (Figure 9). The fourth fish (#29414) was also a noted large distance traveller, having been recorded at the downstream loggers on GW, EGM and the CC between October 7 and 8 with corresponding gate openings at 250 mm (with one gate at 40-100 mm) and 380 mm respectively. It was subsequently tracked 700 m upstream of Picnic Point on October 22 and to the river section between Kirwins Bridge and Bazleys Island between November 13 2003 and February 17 2004. From February 23 this fish moved to the river section upstream of Chinamans Bridge, which also corresponded to average daily temperature of 20 oC and average daily discharges at Seymour in excess of 8,000 ML/day (Figure 9). This fish remained in this upstream section of the study area.
The fifth fish (#29413) was released at Bazleys Island on August 7 and was first tracked moving away from this river section on October 22 at Picnic Point. Then on April 14 it was tracked near the Nagambie Lake Caravan Park and on April 15 was recorded on the upstream logger at Chinamans Bridge. This
fish may have a home range from upstream of Picnic Point to the river below Chinamans Bridge and therefore maybe also related to increasing riverine discharges and stream temperatures.
Figure 9: Golden perch movement past the upstream logger at Chinamans Bridge.
Data includes fish recorded at Chinamans Bridge (black dashed lines) together with the fish frequency identification, average daily discharge at Seymour (solid grey line) and average daily temperature at Chinamans Bridge (dashed black line).
Riverine Golden Perch
Early in the 2003/04 irrigation season a sufficient proportion of the high inflows into the NLS from winter rainfall events were passed down the Goulburn River, resulting in large pulses of high water levels in late August and September (Figure 10). Following this period most of the inflows into the NLS were passed downstream as irrigation releases, with a minimal environmental flow of 252 ML/day being maintained in the Goulburn River until early January 2004 (Figure 10). In early January a fish kill in the Goulburn River below Goulburn Weir prompted an increase in riverine discharge to 750 and 950 ML/day and subsequently to 500 ML/day from mid March 2004 (Figure 10).
After the introduction of 13 golden perch with radio-tags on September 10 2003, the number of fish recorded alive decreased to 10 in October 2003 (Figure 11). These initial mortalities were possibly due to slow healing in the cold water conditions, leading to a rejection of the implanted transmitters.
After this initial drop, the number of fish alive decreased by an average of one every two months, until there is more than half (7 from 13) of the golden perch in the Goulburn River being recorded with mortality signals in February 2004 (Figure 11).
Figure 10: Total irrigation and river discharges from the Nagambie Lakes System during study period (August 2003 to March 2004).
Black dashed line represents discharge at Seymour, grey line represents total irrigation releases and black line represents Goulburn River releases.
Figure 11: Activity status of radio-tagged golden perch from monthly tracking surveys. Solid black line represents number recorded alive, dashed line represents number recorded on mortality and solid bars represents number not found.
On most occasions, monthly tracking surveys found each radio tagged fish within the same river reach and often at the same location as the previous month. In the first month, very little movement was detected and mosant fish appeared to find shelter in the vicinity of their release site. Loggers located at Noorilim and at the Goulburn Weir, however, did provide additional information on fish movements within these monthly sampling trips. These larger scale movements were solely conducted during periods of larger downstream releases.
A large golden perch (Fish #21416) weighing 2,079g with a length of 492 mm that was released downstream from the Cable Hole on August 13 2003, was the most active of all fish tagged. On August 26 it was tracked to the vicinity of the original release location. On September 10 this fish was tracked to a location 1.3 km downstream from the release location and just nine days later was detected on the downstream logger at Noorilim (3 km downstream from the release location) (Figure 12a). This downstream movement appeared to be stimulated by the flow event from September 16 to 28 that peaked at 4,275 ML/day. Then four days later, it moved an estimated 12 km upstream to be detected at the logger situated on Goulburn Weir. Assuming a constant swimming speed, this represents a minimum movement of 132 m/hour upstream against a stream discharge averaging a daily discharge of between 2,475 and 4,275 ML/day. This fish remained below the Goulburn Weir for a day, then returned downstream on September 24 (Figure 12a). On October 21, it was tracked to a location 500 m downstream from the original release location, having travelled 9.5 km, and remained in this vicinity between 500 m and 1.5 km downstream until mid April 2004 (Figure 12a).
The largest golden perch tagged (#23416) at a length of 515 mm and weight of 2,272 g was released downstream from the Cable Hole on August 13 2003 and was tracked 1.5 km downstream from the release location on August 26 (Figure 12b). A month later, on September 10 it was tracked a further 200 m downstream. Nine days later, this fish was recorded moving downstream of the Noorilim logger. It is not certain how far downstream it moved over the next eight days, however, on September 27 as river discharge decreased to 900 ML/day it was recorded moving upstream past the Noorilim logger (Figure 12b). The following month this fish was tracked to a location it had previously visited, 1.5 km downstream from its release site (Figure 12b), where it remained until February 16. It was not recorded after this date and was possibly caught, as a number of searches within the study reach failed to locate this fish.
A smaller golden perch (#31213) with a length of 430 mm and weight of 1,238 g that was released at the same location and date as the previous two fish, was tracked from its release location to 500 m downstream on September 10 (Figure 13a). The mid September flow event stimulated a 2.5 km downstream movement in the vicinity of the Noorilim logger between September 18 and 23, moving downstream past the logger and back upstream the following day on two occasions. A month later on October 21 this fish was recorded 3.5 km upstream at the Cable Hole. It was subsequently recorded on mortality and may also represent a fishing mortality (Figure 13a).
Another smaller fish (#33412) with a length of 422 mm and weight of 1,183 g that was also released at the same location and date, was also stimulated to move downstream of the Noorilim logger on September 22, but returning on September 23. It then returned to the original location a month later on October 21(Figure 13b).
A smaller golden perch (#35413) with a length of 434 mm and weight of 1,170 g that was released just 300 m upstream from the Cable Hole provided the best demonstration of golden perch homing behaviour. This fish also responded to the flow event on September 1 to 4 (with a peak of 1,980 ML/day), where
it was recorded moving in the vicinity of the Noorilim logger on September 2 before travelling back upstream on September 9 (Figure 14). On September 10 it was recorded back upstream of the Cable Hole. It was also detected moving downstream and upstream of the Noorilim logger on consecutive days, September
18 and 19 and then September 23 and 24 (Figure 14). It is not certain if this fish returned to the original location upstream of the Cable Hole between these two downstream movements, however, it was tracked to its original location on October 21and remained in this vicinity until April 2004.
Figure 12: Schematic diagram of the location of golden perch (a) #21416 and (b) #23416 in the Goulburn River in comparison to average daily river discharge and temperature. River discharge provided as an average daily release from Goulburn Weir (ML/day), while average daily water temperatures provided from Murchison (oC). Fish location is expressed as distance from Goulburn River Weir, with arrows representing direction of movement upstream (↑) or downstream (↓).
Figure 13: Schematic diagram of the location of golden perch (a) #31213 and (b) #33412 in the Goulburn River in comparison to average daily river discharge and temperature. River discharge provided as an average daily release from Goulburn Weir (ML/day), while average daily water temperatures provided from Murchison (oC). Fish location expressed as distance from Goulburn River Weir, with arrows representing direction of movement upstream (↑) or downstream (↓).
Figure 14: Schematic diagram of the location of golden perch #35413 in the Goulburn River in comparison to average daily river discharge and temperature.
River discharge provided as an average daily release from Goulburn Weir (ML/day), while average daily water temperatures provided from Murchison (oC). Fish location expressed as distance from Goulburn River Weir, with arrows representing direction of movement upstream (↑) or downstream (↓).
Physical Conditions
Water quality measured on each visit were made at four main locations (Picnic Point, Kirwins Bridge, upstream of Goulburn Weir and Cable Hole on the Goulburn River) during the period of the study using the TPS datalogger. Measurements made 1 m under the surface indicated that temperatures were consistent with results provided below, while conductivity (μS/cm) averaged of 67.6 ±5.9, 57.3 ±8.7, 60.7 ±11.1 and 59.7 ±2.1 respectively, dissolved oxygen (mg/L) averaged 8.5 ±0.5, 8.6 ±0.2, 8.8 ±0.1 and 8.3 ±0.4 respectively, and pH averaged 7.2 ±0.1, 7.3 ±0.2, 7.2 ±0.3 and 7.4 ±0.1 respectively. Water quality profiles indicated little evidence of stratification at any sites. However, during dry periods conductivity increased and temperature decreased at a depth of 4 m (compared to that at 1 m depth) at Picnic Point and the Cable Hole by 9 and 57 μS/cm and 1.4 and 1.3 oC respectively.
Six continuous temperature monitors were installed for this study, including sites at the Nagambie Rowing course, the downstream entrance to Nagambie Lake, Picnic Point, Kirwins Bridge, Goulburn Weir Pool and at the entrance to Cattanach Canal (see Figure 1, Appendix 1). The logger near the rowing
course was removed during the study, which meant there were only five loggers operating. Supplementary information was obtained for Chinamans Bridge, Goulburn River and Murchison from
the data collection programs (Michael Lake-SKM and Pat Feehan-GMW).
Overall the seasonal temperature increase started in mid September, but was punctuated by a series of drops from early October onwards, with the trough being reached in early January when sudden temperature decrease of 6-9 oC was observed at all locations over an 8 day period (January 2-10) (Figure
15). The temperature profile then appeared to shift to a level from that point on with the continued release of irrigation water from Lake Eildon, maintaining median temperatures at most stations around 20 oC.
Picnic Point Nagambie Lake Entrance Chinamans Bridge
Figure 15: Average daily temperature plots for six continuous temperature stations within the study area.
Average daily temperature provided includes (from upstream to downstream): (a) Chinamans Bridge (blue line), Nagambie Lake Entrance (black line), Picnic Point (orange line); (b) Kirwins Bridge (light blue line), Goulburn Weir Pool (red line), Cattanach Canal Entrance (green line) and Goulburn River at Murchison (dark blue line).
Two of the sites were located off stream within backwaters, one at the downstream entrance to the Nagambie Lake and the other just upstream from Picnic Point, which was located further away from the main river channel. As a consequence, the average daily temperatures at the Picnic Point site were up
to 1.4 oC warmer than those at the Nagambie Lake entrance, which were up to 1.4 oC warmer than at Chinamans Bridge (Figure 15a, Figure 16). Additionally the daily temperature variation of these two off Movement of golden perch and Murray cod in the Nagambie Lakes System 26 stream sites was much higher
with daily temperature variations of up to 6 oC compared to 3 oC at the sites located within the main river channel (Chinamans Bridge, Kirwins Bridge, Goulburn Weir Pool and Cattanach Canal entrance). The temperature variability at the Picnic Point site was much higher over a diurnal period due to the
higher solar flux effect of this shallower site (~ 1 m total depth). Average daily temperatures gradually increased with distance downstream within the NLS throughout the study period. A comparison of the average daily temperatures between September 12 2003 to March 16 2004 demonstrates temperature increases
moving downstream from Chinamans Bridge to Kirwins Bridge, Goulburn Weir Pool and the Cattanach Canal entrance (Figure 16). The maximum, 80th percentile, median, 20th percentile and minimum temperature also increases along a downstream path. For example the 80th percentile increases from 20.4 to 20.7,
20.9 and 21.1 oC at Chinamans Bridge to Kirwins Bridge, Goulburn Weir Pool and the Cattanach Canal respectively. The median increases from 19.1 to 19.5, 19.8 and 19.9 oC and the 20th percentile increases from 14.7 to 15.1, 14.9 and 15.2 oC
Figure 16: Box plot of water temperature monitoring sites.
Information provided includes: maximum (extent of top bar), 80th percentile (top of box), median (bars connected by dashed line), 20th percentile (bottom of box), minimum (extent of bottom bar). Average daily temperatures in the Goulburn River at Murchison, however, were up to 3.5 oC warmer than those observed in Lake Nagambie. This pattern was to be expected given the increased influence of external radiation sources and the relatively lower volume of water in the Goulburn River at Murchison, especially during periods of minimal environmental releases of 252 ML/day.
Fluctuating water level within the lake has been identified as a potentially deleterious impact on the fauna within the NLS (Zampatti et al. 1996, McGuckin 2002, SKM 2002) and was therefore important to consider. Lake level was recorded at the upstream gauge by GMW and supplied by Steve Hall. Lake
levels were initially low, with troughs below the general operational level of 124.2 m (recorded at the upstream gauge) with a minimum water level of 123.25 m (August 22) and 123.6 m (September 16). After September 17, however, the lake levels remained relatively constant between 124.14 and 124.26 with
a gradual decline over time (Figure 17)
Figure 17: Lake level during the study period (recorded at the upstream gauge)
Water level information in mAHD where at full supply the lake is at 124.24. Information supplied by Steve Hall (GMW).
Habitat Utilisation
There was a high association of Murray cod to the main river channel running south to north through the NLS. Murray cod without mortality signals were located (after August) in deeper water in the main river channel at least 70% of the time (from 79 records). The remaining 30% were mostly comprised of observations of the eight fish that occupied their release site, in the backwaters adjacent to Bazleys Island. Murray cod within the NLS were always associated with some form of instream habitat, generally large woody debris, and were usually found in pools greater than 5 m deep.
Golden perch within the NLS were also strongly associated with the deeper water associated with the main river channel, being recorded there 90% of the time (from 121 records from August 14 2003). Golden perch within NLS were always associated with some form of instream habitat, generally large woody debris.
In all instances, the riverine golden perch were located in relatively deep pools of over 1 m. and within close proximity to complex woody debris habitats. Occasionally some fish were found in the vicinity of large rocky substrates associated with rock bars and rock rubble. All fish occupied permanent location (home range) of less than 1 km of the capture and release location. Movement outside this range only occurred during rare events such as high riverine discharges of 2,000 ML/day or greater (as discussed earlier). It is not certain of the extent of this occasional migration, however, downstream migrations of at least 3.5 km followed by a return journey to the original home range were common.
Food Availability
A once-off investigation using bait and light trap survey was conducted on March 17 and 18 2004 to assess food availability for the large recreational fish species. Two sites were chosen to compare the food availability in the NLS (immediately upstream of Picnic Point) and in the river downstream from the Goulburn Weir (immediately upstream of Cable Hole).
With a similar fishing effort for the two locations, there was an overall lower total abundance (158 individuals) and a higher diversity (8 species) within the lake. There was an overall greater diversity of small fish including flat-headed gudgeon (8 %), carp gudgeon (6 %), Australian smelt (3 %)
and only one capture of a hardyhead species and redfin. There was also a high proportion of freshwater shrimp (71 %) as well as other macro-crustacean species including freshwater prawn (5 %) and yabbies (6 %). The one species notably missing from the capture list was freshwater spiny crayfish, which
has previously been found in the NLS. Other species including golden perch, freshwater catfish, goldfish and European carp may have also been present, but were not likely to have been caught using this capture technique.
Figure 18: Proportion of small species capture from light and bait trap survey at Picnic Point.
By comparison the riverine aquatic fauna was more abundant (total abundance of 254 individuals) and less diverse (4 species). There was a dominance of freshwater prawns (91 %), a low abundance of freshwater shrimp (7 %) with only 3 yabbies and 1 freshwater spiny crayfish collected. There was a distinct lack of smaller fish in the catch from this river section, given the large number of smelt that could usually be seen from the riverbank. These results indicate that the affects of the fish kill in early January may have significantly impacted not only the abundance but also the recruitment potential of these smaller fish species in this section of the river.
Figure 19: Proportion of small species capture from light and bait trap survey at the Cable Hole.
Discussion
Introduced Murray cod
On the second day after release, all but one Murray cod were alive. One radio tagged Murray cod released at Kirwins Bridge was captured by a pelican. One of three pelicans found in the vicinity of Bazleys Island had taken the Murray cod and was still capable of flight. In pursuit another of the three pelicans rejected a large European carp of similar size to the captured Murray cod. Once digested the transmitter from this fish was expelled by the pelican further upstream within the NLS. We suspect that at least one other Murray cod was captured by a pelican near Picnic Point and the transmitter rejected further downstream in the NLS. Such evidence demonstrates the potentially high predatory rates of pelicans in the NLS, particularly in the shallow backwater areas. It also suggests that large hatchery raised Murray cod are likely to be unaccustomed to the lake environment and associated predators and therefore may be particularly susceptible.
Mortality rates of Murray cod were initially high at 3 weeks (8 of 32 = 25%) and continued to increase throughout the trial, at 8 weeks (11of 32 = 34%), 13 weeks (16 of 32 = 47%) and 16 weeks (21 of 32 = 66%). Apart from predation by pelicans or other potential predators (eg. large turtles, water rates), other reasons for this high mortality rate could include:
- angler captures rates as high as 17 % (and possibly 25 %) for golden perch in the Murray River between the Loddon River and the Darling River confluences (O'Connor et al. 2002) may have also been a significant factor in this study;
- tag rejection due to infections post surgery in other radio tagging trials were as high as 20% for golden perch (O'Connor et al. 2002) and 37% for European carp (Stuart and Jones 2002) and may have also been high in this study;
- consequences of introducing hatchery reared fish into a foreign environment, including a number of potential issues such as food and habitat suitability, lack of predatory instincts and lack of prey avoidance instincts; and
- consequences of unsuitable (or harmful) environment, including intolerable water quality conditions, and limited food and habitat availability.
All Murray cod released into the NLS remained in the vicinity of the release site, with the largest movement being 1000m upstream. This lack of movement could partly be explained by the sedentary habits of Murray cod, however, it was more likely a result of the failure of these fish to acclimatise to the conditions in the NLS. In summary, these results suggest that the stocking large Murray cod reared in hatchery conditions is unsuitable as these fish will fail to acclimatise and survive to the conditions Movement of golden perch and Murray cod in the Nagambie Lakes System 31 experienced in the NLS. It should, however, be acknowledged that the Murray cod used in this trial were acclimatised for one day prior to being released within the NLS and that longer acclamation, or selection of fish from hatchery ponds more similar to the NLS, would be beneficial for future stocking programs. Fish sourced from brood stocks that are assimilated to colder temperatures such as from hatcheries in Alexandra or Beaufort should be more suitable to conditions in the NLS. Additionally, it is recommended that stocking fish between 150-200 mm would be advantageous as at this size the stocked fish would be capable of exploiting the small fish and macroinvertebrates present in the NLS and be less impacted by terrestrial predators. Stocking fish during warmer months should also ensure that food availability has reached a maximum abundance.
Translocated Golden Perch
The golden perch translocated into the central release locations in the NLS were highly mobile with downstream movements to the outlet channel being made throughout most of the study period (Figure 20a). Five of the 15 released were emitting a mortality signal by December suggesting a mortality rate (and/or rejection rate) of 33 %, which was still high but comparable to rates established by O'Connor et al. 2003 (rejection rate of 20 % and angler recaptures of at least 17 %).
Out of the 10 remaining golden perch, seven fish travelled considerable distances (ie. >3 km) to explore downstream passage at one of the three irrigation outlets and by January 2004, 3 had successfully moved downstream. On October 17 the first fish (#31217) to move through the EGM outlet gates did so at an opening of 800 mm. This outlet was also approached another 24 occasions by four other radio tagged golden perch, all of which had approached the CC or SMC before or after visiting the EGM outlet. Approaches made without passing downstream occurred during gate openings of 40, 100, 320, 340, 400, 410, 450, 660, 720, 790, 960, 970 and 1150 mm. The other two fish that successfully passed downstream moved down through the SMC outlet gates on November 30 (#35417) and December 20 (#23415), corresponding to openings of 350 mm and 480 mm respectively. All three fish that passed through the outlets survived the passage as was the case for similar sized golden perch tracked passing down through the Torrumbarry Weir with gate openings of 300 mm and velocities exceeding 3 m/s (O'Connor et al. 2003).
Five other radio tagged golden perch approached the SMC on 20 different days but did not pass through. One of these fish (#31217), was recorded from October 8 to 13 at the SMC during gate opening of 250 mm but later passed through the EGM. The other approaches were at gate openings of 420, 550, 620, 650 and 800 mm, including multiples of 2 fish in early January during opening at 620mm and multiples of 3 during early October at a gate opening of 250mm.
None of the 7 radio tagged golden perch that approached the CC outlet on 15 different days passed through. Three of these fish were the above mention fish that passed through the other outlet after approaching the CC outlet gate openings of 100, 170, 330 and 900 mm. The other approaches to the CC Movement of golden perch and Murray cod in the Nagambie Lakes System 32 outlet were made during openings of approached at 120, 230, 240, 260, 270, 330, 380, 400, 420, 830mm and included multiples of three fish on some occasions. Despite high patronage no fish were willing to pass through the CC outlet.
All of the 7 golden perch that approached the outlet gates demonstrated a willingness to exit downstream by investigating at least the CC and SMC outlets, while some moved back and forth from the EGM, CC and SMC. Four of these fish were reluctant to pass through, even at gate openings equivalent to the successful downstream passes made by the other three fish. This highlights the variability in the willingness of each fish to pass through such obstacles. O'Connor et al. (2003) also found, for at least 80 % of the time, golden perch returned back upstream after approaching Torrumbarry Weir, leading to the conclusion that there were large congregations of fish wanting to move downstream. While flow attraction is thought to be the main cue encouraging fish toward an downstream outlet, there are a number of possible cues that would prevent fish from passing through such obstacles. These may include physical influences such as increased turbulence and visual cues, such as shadowing and the height of the structure (Haro et al. 1998). Such stimulus may partly explain the lack of downstream movement though the CC outlet. Therefore to prevent fish moving down these structures, the behavioural cues of fish could be targeted to cause fish to be startled away from the outlet. Attempts could be made to increase shadowing or turbulence in the upstream approach to the outlet or to introduce vibrating structures that would also repel the fish. Such an approach would require a significant amount of testing.
The proven approach to prevent downstream migration of fish through outlets is the installation of screens. There are a number of different screen designs (Blakeley 2003) which need to be assessed for suitability to the swimming abilities and behaviour of the fish together with the outlet release requirements and constraints. It is recommend that installation of fish screens be investigated as a necessary requirement to maintaining a self sustaining fish population in the NLS.
Golden perch also made substantial upstream movements to Chinamans Bridge predominantly in the later part of the study period and corresponded to temperatures greater than 20 oC, flow pulses of 5,000 to 8,000 ML/day (Figure 20a). Five fish moved upstream later in the study period in contrast downstream movements of golden perch within the NLS occurred throughout the study period (Figure 20a).
Golden perch within the NLS demonstrated a highly mobile habit. Three of the five upstream travellers were recorded downstream searching for a downstream exit from NLS prior to and after the upstream movement. Only one of the 10 remaining tagged golden perch in the NLS in December 2003 remained within its home range where it was released. The other 9 made frequent movements upstream or downstream, which supports the notion that golden perch commonly make large distance trips upstream and downstream (Mallen-Cooper et al. 1995; O'Connor et al. 2003). In comparison to the tagged golden perch in the Goulburn River, the golden perch in the NLS were much more mobile (Figure 20).
This may be related to the effects of these fish being translocated to unfamiliar surroundings and conditions, differences in food and habitat resources, unsuitable conditions requiring fish to exit the NLS or alternatively may simply reflect the natural exploratory habits of these fish given enough
water to move. Figure 20: presented includes (a) discharge at Seymour (grey line), upstream movements in the NLS (blue bars at the bottom) and downstream movements in the NLS (red bars at the top); and (b) riverine release from Goulburn Weir (black line), upstream movements in the in the Goulburn River (blue bar at the bottom) and downstream movements in the Goulburn River (red bars at the top).
Riverine Golden Perch
Seven of the 13 radio tagged fish in the Goulburn River were emitting a mortality signal by the end of the study period. This was again a high mortality rate and could be due to a number of factors, such as unhygienic surgery techniques, sub-standard environmental conditions or high fishing or predatory mortality. One other fish was missing in February 2004 and was suspected to have been an angler capture after exhaustive searches of the river section. This fish (#23416) had previously undertaken large distance downstream movements and returned back to its home range. In this trial it was necessary to release tagged fish prior to irrigation releases in mid August during the colder period of the year which may have slowed the healing of incisions made in the fish during surgery. Acclimatisation may also have been more difficult during this period of the year, particularly for fish sourced from hatchery conditions.
The movement patterns of fish in the Goulburn River clearly demonstrate the need for at least 3-4 weeks of acclamation period for fish prior to determining indicative movement patterns. Of the nine tagged fish released on August 13, only 1 had moved from its original release location on August 26 and none appeared to respond to the flow event on August 25 to 30, of over 10,000 ML/day. Similarly, at least five of the nine fish tagged on August 13 reacted to the flow event from September 16 to 28, however, none of the four fish tagged and released on September 10 appear to react in a similar manner. This necessary acclamation period is supported by other tagging programs were it has been suggested that four weeks is recommended prior to determined normal movement pattern (Baras and Westerloppe 1999).
For the majority of the study period, all fish were tracked within 1000 m of its previous location the month before demonstrating a strong home range habit as found by radio tagging trials in the Broken River (Crook 2004). In contrast to the translocated fish in the NLS, golden perch in the Goulburn River moved only during significant flushes (Figure 20b). In all cases fish returned to the previous location prior to the flush of water down the river. Three fish made downstream movements during the early September flush (peaking at 1980 ML/day). It therefore appears flows of 1,000 to 2,000 ML/day are required to stimulate golden perch to make large distance movements outside their home range in the river below Goulburn Weir. The results may also suggest that flows under 900 ML/day were insufficient for these fish to travel outside their home range. Firstly, the golden perch that made downstream movements in September 2003 consistently returned to their original home range when discharges decreased below 1000 ML/day and secondly there was a distinct lack of movement and in mid-January following flushing releases of 900 ML/day following the fish kill. O'Connor et al. (2003) also found a strong affiliation between large downstream movements of golden perch and large riverine flows from year to year. In 2000, 14 out of 18 tagged fish moved greater than 10 km downstream corresponding to discharges of more than 15 000 ML/day while only 3 of 27 fish moved in 2001 more than 10 km when no large riverine flushes occurred (O'Connor et al. 2003). Mallen-Cooper et al. (1995) recommend flushes of 30 to 80 % exceedance are important for initiating migration by golden perch and silver perch. Natural flows in the Goulburn River at Murchison of 30 and 80% exceedance have been modelled at approximately 7000 and 1000 ML/day respectively (Cottingham et al. 2003). Although there were no recommendations, Cottingham et al. (2001) stressed the importance of spring flushes. Results from this study support the need to reinstate flushes of at least 1000 ML/day below Goulburn Weir to enable golden perch populations to undertake downstream movements.
Sustained spring flushes are likely to be very important for these fish and potentially all other fish species in the system. In the spring of 2003, there was only 13 days where releases from Goulburn Weir exceeded 1000 ML/day. Where possible, sustained spring flushes >1000 ML/day should be released. This lack of sustained spring flows was supported by evidence from larval surveys conducted by Koster et al. (2004) that indicated golden perch and silver perch failed to spawn in 2003/2004.
Golden perch are known for their large distance nomadic behaviour, travelling distances of over 1000 km (Reynolds 1983). Large distance downstream trips are associated with optimising or enriching feeding, avoiding unfavourable conditions, enhancing colonisation, or optimising reproductive success (Northcote 1978). Such trips are also thought to be important for trout as an exploration exercise to provide knowledge regarding navigation and other food resources (Baker 1982). In this case feeding is the suspected motivation, given that these flows lead to wet inundated backwater habitats, including low lying red gum sampling stands. O'Connor et al. (2003) noted that these red gum stands in the Murray River represented a significant proportion of sites visited during periods of high flow and were thought to provide food such as terrestrial invertebrates, worms and insect larvae.
Low flows in summer are also thought to be important for golden perch and silver perch while at the same time disadvantage introduced fish species such as European carp (Humphries et al. 1999). While this strong association with flushes demonstrates the opportunistic nature of golden perch, the home range habit during low flow periods demonstrates this species' resilience. Together these characteristics make it ideally suited to flushes in spring and low flows in summer.
One of the radio tagged golden perch (#21416) travelled approximately 12 km upstream to the Goulburn Weir during a river release of 4,275 and 2,475 ML/day. This demonstrates that a fish lift on Goulburn weir would attract some fish. It has previously been suggested however, that the priority of a fishway construction would need to be weighed up against the need to re-establish a healthy fish population within the NLS and the need for re-establishing a more natural flow regime (McGuckin and Bennett 1999, Cottingham et al. 2003).
Physical Conditions
The major thermal changes that can occur downstream of large irrigation dams include reduced seasonal amplitude, reduced daily amplitude, rapid temperature changes and a delayed summer temperature peak (Saltveit et al. 1994, Lugg 1999). The irrigation releases from Lake Eildon are known to significantly impact the Goulburn River downstream at least as far as Seymour (Gippel and Finlayson 1993, Ryan et al. 2001). The extent of thermal impacts as far as the NLS is largely undetermined due to a lack of information. In 2002, GMW in conjunction with DSE and SKM undertook a continuous temperature-monitoring program throughout the Goulburn River, including 3 sites in Lake Nagambie.
Evidence collected by this project and by other sources indicates that the greatest influence on temperature in the NLS is the large volume of water entering from upstream. There is no evidence of temperature stratification (Zampatti et al. 1996, Swingler and Lake 2003, McGuckin 2002).
Temperatures in the backwater habitat, such as upstream of Picnic Point, demonstrate greater diurnal variation and greater seasonal temperature variation in these shallower environments. While there is a slight increase in temperature with distance downstream through the NLS, there is no appreciable warming of water within the main channel of flow. Median temperatures within this main channel for the 2003/04 irrigation season (the study period of this project) were below 20 oC. The temperature 80 th percentile was 21 oC or less throughout the whole system. Temperatures over 20 oC were sustained in December (with a median under 22 oC), but fell early January and were then maintained at a median temperature around 20 oC by large irrigation transfers from Lake Eildon.
The spawning temperatures for species such as golden perch (23 oC), silver perch (23 oC) and freshwater catfish (24 oC) (Koehn and O'Connor 1990) are likely to be achieved within at least the backwater within the NLS, however evidence collected during this study period indicates that reproductive success could be compromised. The development of reproductive capabilities of warmwater fish would be impacted by large and relatively rapid temperature decreases as demonstrated in early January 2004 and November / December 2003. These large decreases potentially in the middle of the spawning season for these fish should be avoided where possible. While warmer temperatures were available in the backwater habitats and may be suitable for larvae, the suitability of this habitat to adult native warmer water fish species is questionable based on the bathometry and proportion of time tagged fish spent in them. For the majority of time tagged fish maintained positions adjacent to the main channel of flow, where cooler temperatures were maintained.
Other potential water quality concerns include heavy metals (such as chromium, copper and silver) in water column at low toxicity level (Zampatti et al. 1996) and high concentrations of phosphorus and ammonia (Grace et al. 2001) that bind to the sediment and continue to accumulate within the backwater environments. The possibility of re-mobilising such components makes dredging a hazardous practice Movement of golden perch and Murray cod in the Nagambie Lakes System 37 to undertake (Grayson and Scanlan 1998, Zampatti et al. 1996). However, if all precautions are taken (including extensive sediment analyses) the long term goals may be great with the possibility of opening up the backwater habitat and reintroducing greater flow (Piani 1998).
Another consequence of accumulating nutrients and the artificially high water levels in summer / autumn is the proliferation of pest aquatic plant species in the NLS such as fanwort (Cabomba caroliana) and yellow waterlily (Nyphaea mexicana). The preferred option to control these weeds has historically been a comprehensive Glyphosate spraying program (Bateson 1997) and water level manipulation to expose these pest plants to cold winter conditions. Repeated Glyphosate spraying apparently has no long term impacts on water quality (Bateson 1997) however there appears to be some uncertainty as to the potential for Cu and CuSO4 in the sediment (AWT 1999a). Together with the introduction of carp and increased sedimentation, the lowering winter water levels has been identified as a potential cause for the decline in ribbonweed (Vallisineria spp) (McGuckin 2002). However, water manipulation reflecting more natural conditions, (eg. lowering backwaters in summer/autumn) has been suggested as a less destructive method of controlling the pest plants without disadvantaging native species (AWT 1999b). Lewin and Lloyd 2000 suggested a lowering in late winter / early spring for 1-6 months to control fanwort while not disadvantaging native species including the endangered watershield (Brassenia scherberi), watermilfoil (Myriophyluum spp.), ribbonweed and water primrose (Ludwidgia spp.).
The diversity of habitat and floristic components within the NLS is high with 17 different vegetation zones identified based on dominant plant species (WES 1997, AWT 1999b). There is a great potential to enhance this diversity of macrophytes and other aquatic components in the NLS, such as red gum stands, primary production and biofilm abundance (Roberston et al. 1999) with strategic water level and flow manipulation techniques. Variable wetting regimes are most beneficial for maintaining wetland biodiversity (Langley et al. 2001). These should include large flooding flows of greater than 10,000 ML/day (Mc Guckin 2002) or flows between 15,000 and 60,000 ML/day to enable the flushing of backwater habitats thereby providing a fresh start.
Fish Habitat Related Issues
Large bodied fish require deep water to avoid predation from terrestrial predators. Large complex woody debris would assist the fish to avoid predation but would also provide shelter from large instream velocities. It is not surprising then that the radio tagged fish were tracked during daylight hours to deeper water habitat immediately adjacent to large woody debris. The strong association with depth and large instream structures has also been found in other radio tracking trials for golden perch in other lakes such as Lake Eildon (Fisheries Victoria, 2003) and in rivers (Crook et al. 2001' O'Connor et al. 2003), and for Murray cod (Koehn and Nicol 1998).
The biological importance of woody debris for all aquatic processes appears indisputable with multitude of supporting reports and papers (eg. Crook and Robertson 1999, Brooks et al. 2003). While it appears that significant de-snagging has occurred within the main channel of flow, the majority of timber within the backwaters of the NLS remains intact. It therefore seems necessary to provide large bodied fish with greater access to the large woody debris within the backwater habitat. This would assist by increasing habitat, increasing potential food resources and provide offstream habitat for spawning and recruitment. The instream woody debris and riparian vegetation in the Goulburn River immediately below the NLS is relatively intact. The biggest habitat impact on the Goulburn River below the Goulburn Weir appears to be the reduction in natural flow events. Sustained flushes are required for fish populations to move further distances in the system to enable the utilisation of all resources, including newly inundated floodplain.
The fish kill that occurred in early January 2004 is likely to have a large impact on the native fish species with anecdotal reports of large numbers of large and small species observed dead and dying along this section of river. The results of the bait and light trapping survey as part of this study indicated a distinct lack of small native fish species in the Goulburn River at the Cable Hole, including Australian smelt, hardyhead species, flat-headed gudgeon, crimson-spotted rainbowfish and carp gudgeon. In February 2004 Koster et al (2004) also found a lack of golden perch, river blackfish and trout cod and an overall reduction in fish abundance of 71% compared to a survey conducted in October 2003. While it can be expected that the smaller fish species would recover from this event and recolonise, the recovery of the populations of large fish species may require additional support. Restocking this section of the river with trout cod and Murray cod may be warranted.
Conclusion
The overall conclusions from trials conducted in this study support and expand on many of the recommendations from previous management and research plans (Piani 1998, Lewin and Lloyd 2000, McGuckin 2002, SKM 2002, Cottingham et al. 2003) developed for the Goulburn River and the NLS. Within the NLS, introduced Murray cod exhibited a sedentary habit and remained in close contact with the river channel, while translocated golden perch demonstrated a highly mobile habit. The survival of introduced Murray cod in the NLS could be enhanced by extra consideration of potential predation pressures, acclimatisation of stocks prior to release and the provision of additional instream habitat. The maintenance of golden perch stocks within NLS could be improved with additional trials that exploit the behavioural characteristics of these fish; installation of fixed vertical screens; and improved connectivity with suitable backwater habitat.
Golden perch populations in the river below Goulburn Weir by comparison were less mobile, maintaining a relatively small home range until larger releases were made over of at least 1000 ML/day. Conditions below Goulburn Weir could be improved by ensuring an adequate water quality of release water, an increase in the base flow conditions and the provision of sustained spring flushes. The improvement of connectivity with the main channel and the backwater habitat and strategic water level management to reflect natural conditions is likely to improve conditions for desirable flora and fauna species (including key recreational fish species) while also disadvantaging exotic pest species.
Recommendations to fisheries managers of the NLS
The key findings of this research highlight a number of research priorities and management considerations that support and expand on previous recommendations made for the NLS. The main aim of these priorities are listed below with the intention to maximise the potential to develop selfsustaining recreational fish populations in the NLS:
Research Priorities
- Assess the interaction between fish habitat requirements, including water depth, large instream
structures and loss of fish due to terrestrial predators within the NLS - Assess the suitability of backwater habitat for larval fish (including primary and secondary
ecological production) and explore the rehabilitation options and potential impacts - By firstly conducting additional comparisons on the three irrigation outlets in NLS, explore the
potential to increase reluctance of fish to approach the outlet structures (eg. increased turbulence,
vibration, shading) - Additional water quality and sediment monitoring should be conducted (including additional
backwater sites) to ensure suitable water quality is being maintained within and being released from
the NLS
Management Considerations
- Assess the suitability of fish screens for the three irrigation outlets to prevent the downstream passage of fish
- Consider sourcing stocked fish from cold water acclimatised brood stock
- Where possible limit stocking activities to warmer months
- Stocking of fish 150 to 200 mm in the warmer months (preferably spring) would be advantageous to enable the exploitation of prey items available (small fish and invertebrates) and reduce the impacts of terrestrial predation
- Explore the possibility of providing additional connectivity of the main channel and backwater habitat with use of flood flows, on-ground works to improve strategic flow manipulation and prevent sedimentation of backwater habitat
- Explore the potential to vary water levels in the NLS to reflect the variability and seasonality of natural conditions in an attempt to improve conditions for desirable flora and fauna species (including key recreational fish species) while also disadvantaging exotic pest species
- Increase riverine releases from Goulburn Weir to ensure the base flow conditions provide additional access and habitat and be varied to include greater frequency of spring/summer flushes of at least 2000 ML/day to ensure the inundation of backwater habitat including shallow red gum stands
- Where possible incoming water into the NLS should be managed to prevent rapid temperature fluctuations in spring and summer
References
AWT (1999a) Investigation into the sedimentation of a lagoon at Nagambie Lakes System: Report for Goulburn-Murray Water. Report No. 280/99. AWT, Victoria.
AWT (1999b) Draft investigation into the growth conditions of Cabomba caroliniana in the Goulburn Weir System: Report for Goulburn-Murray Water. AWT, Victoria.
Bateson, J. (1997) NLS Glyphosate Spraying Program Water Quality Monitoring Program Report: report prepared for Goulburn-Murray Water. Water Ecoscience Pty Ltd.
Baker, R.R. (1982) Migration: paths through time and space. Hodder and Stoughton, London.
Baras, E. and Westerloppe, L. (1999) Transintestinal expulsion of surgically implanted tags in Africancatfishes Heterobranchus longifilis of different size and age. Transactions of the American Fisheries Society. 20: 81-107.
Baker, R.R. (1982) Migration: paths through time and space. Hodder and Stoughton, London.
Blackley, T. (2003) Screening Irrigation offtakes in the Murray-Darling Basin to reduce loss of Native fish. Department of Civil Engineering, Monash University.
Brooks, A.P., Brierley, G.J. and Millar, R.G. (2003) The long term control of vegetation and woody debris on channel and floodplain evolution: insights from a paired catchment study between a pristine and a disturbed lowland alluvial river in southeastern Australia. Geomorphology: 51: 7- 29.
Brumley, A.R., Morison, A.K. and Anderson, J.R. (1987) Revision of the conservation status of several species of warm water native fish after surveys of selected sites in northern Victoria (1982- 1984). Arthur Rylah Institute for Environmental Research, Department of Conservation, Forests and Lands, Victoria. Tech. Report Series No. 33.
Cottingham, P., Stewardson, M., Crook, D., Hillman, T., Roberts, J., Rutherfurd, I. (2003) Environmental flow recommendations for the Goulburn River below Lake Eildon. CRC Freshwater Ecology. Technical Report 01/2003.
Crook, D. and Robertson, A. (1999) Relationships between riverine fish and woody debris: implications for lowland rivers. Marine and Freshwater Research. 50(8): 941-953.
Crook, D.R., Robertson, A.I., King, A.J. and Humphries, P. (2001) The influence of spatial scale and habitat arrangement on diel patterns of habitat use by two lowland river fishes. Oceologia. 129: 525-533.
Crook, D.R. (2004) Is the home range concept compatible with the movements of two species of lowland river fish?. Journal of Animal Ecology. 73: 353-366.
DNRE (2002) The FLOWS method: a method for determining environmental water requirements in Victoria. SKM, CRC Freshwater Ecology, Freshwater Ecology (NRE), and Lloyd Environmental Consultants report to the Department of Natural Resources and Environment, Victoria.
DCNR(1995) The bulk entitlement conversion process. Bulk water entitlements report series, Report No. 2. Department of Conservation and Natural Resources, Victoria.
Fisheries Victoria (2003) MAFRI Research – Tracking Golden Perch in Lake Eildon. Fish-Fax. 91, 15
May 2003.
Fisheries Victoria (2002) Goulburn-Eildon Region Fisheries Management Plan. Department of Natural Resources and Environment.
Gippel, C.J. and Finlayson, B.L. (1993)Downstream Environmental Impacts of Regulation of the Goulburn River, Victoria, Hydrology and Water Resources Symposium, Newcastle, The Institution of Engineers Australia 93/14: 33-38.
Grayson, R. and Scanlon, P. (1998) Preliminary assessment of options for flow enhancement to control niusance weeds around Baxters Island – NLS/Goulburn Weir: Report to Goulburn-Murray Water. CEAH Report 8/98. Centre for Environmental Applied Hydrology.
Haro, A., Odeh, M., Noreika, J. Castro-Santos, T. (1998) Effect of Water Acceleration and downstream migration behaviour and passage of Atlantic Salmon smolts and juvenile Amercian Chad at surafce bypassess. Transactions of the American Fisheries Society. 127: 118-127.
Koehn J.D. and O'Connor W.G. (1990). Biological Information for Management of Native Freshwater Fish in Victoria. Freshwater Fish Management Branch, Arthur Rylah Institute for Environmental Research, Department of Conservation and Environment, Melbourne. 165 p.
Koehn, J.D. and Nicol, S. (1988) Habitat and movement requirements of fish. In Banens, R.J. and Lehane, R. (eds) Proceedings of the 1996 Riverine Environment Research Forum, Brisbane, Queensland, October 1996. Murray-Darling Basin Commission, Canberra.
Koster, W.M., Crook, D.A. and Fairbrother, P. (2004) Surveys of fish communities in the lower Goulburn River. Annual Report 2003/2004. Report to Goulburn Valley Association of Angling Clubs. Arthur Rylah Institute for Environmental Research, Department of Sustainability and Environment, Victoria.
Lewin, K. and Lloyd, L. (2000) NLS Seed Bank Study: Fnal report for Goulburn Murray Water. AWT and Lloyd Environmental Consultants.
Lucas, M.C. and Baras, E. (2000) Methods of studying spatial behaviour of freshwater fishes in the natural environment. Fish and Fisheries, 1: 283-316.
Lugg, A. (1999). Eternal Winter in Our Rivers: Addressing the Issue of Cold Water Pollution. NSW Fisheries.
Mallen-Cooper, M., Stuart, I.G., Hides-Pearson, F., and Harris, J. (1995) Fish Migration in the Murray River and Assessment of Torrumbarry Fishway. Final Report for NRMS project Noo2, NSW Fisheries and CRC for Freshwater Ecology.
McGuckin, J. (2002) An investigative study of the fish fauna of the Nagambie Lakes and Chateau Tahbilk Lagoon. Report for the Nagambie Angling Club. Streamline Research Pty Ltd.
McGuckin, J. and Bennet, P. (1999) State fishway Program: An inventory of fishways and potential barriers to fish movement and migration in Victoria. Department of Natural Resources, Victoria.
Northcote, T. G. (1978) Migratory Strategies and Production in Freshwater Fishes, In: Gerking, Ed. Ecology of Freshwater Fish Production.
O'Connor, J., O'Mahony, D. and O'Mahony, J. (2003) Downstream Movement of Adult Murray
Darling Fish Species: with particular reference to the impact of weirs on that movement. Arthur Rylah Institute for Environmental Research, Department of Sustainability and Environment, Victoria.
Piani, A. (1998) NLS Storage Management Plan: Water Quality and Biodiversity Strategy. Goulburn Broken Catchment Management Authority, Goulburn-Murray Water and Natural Hertitage Trust.
Reynolds L.F. (1983) Migration patterns of five fish species in the Murray-Darling River system. Australian Journal of Marine and Freshwater Research. 34: 857-871.
Roberston, A.I., Bunn, S.E. Boon, P.I. and Walker, K.F. (1999) Sources, sinks and transformations of organic carbon in Australian floodplain rivers. Marine and Freshwater Research, 50: 813-830.
Russell, D.J. (1991) Fish movements through a fishway on a tidal barrage in sub-tropical Queensland.Proceedings of the Royal Society of Queensland. 101:109-118.
Saltveit S.J., Bremnes T. and Brittain J.E. (1994). Effect of a Changed Temperature Regime on the Benthos of a Norwegian Regulated River. Regulated Rivers: Research and Management, 9: 93-102.
Sinclair Knight Merz (SKM) (2002) Ecological review of the status of the NLS system.
Stuart, I. and Jones, M. (2002) Ecology and Management of common carp in the Barmah-Millewa forest. Arthur Rylah Institute for Environmental Research, Department of Sustainability and Environment, Victoria.
Swingler, K. and Lake, M. (2003) NLS: Temperature and stratification investigation 2002/2003. Final report to Goulburn-Murray Water. Sinclair Knight Merz, Armadale, Victoria. July 16, 2003, 16pp.
WES (1997) An assessment of the aquatic vegeation of the Goulburn Weir system. Water Ecoscience Pty Ltd for Goulburn-Murray Water. Melbourne.
Zampatti, B., Loone, J. and Hunter, K. (1996) NLS water quality study: final report. Water Ecoscience, WES Report No. 57/96.
Appendix 1: Radio Tracking Logger Station Description
| Location | Description | Direction A1 | Direction A2 | Direction A3 |
|---|---|---|---|---|
|
Upstream logger | Approximately 600m
| Upstream | Downstream | N/A |
|
East Goulburn Main Channel | Within enclosed compound
| Towards lake | Downstream | N/A |
|
Cattanach Channel | Within enclosed compound
| Towards lake | Downstream | N/A |
|
Stuart Murray Channel | Within old surface release
| Towards lake |
Downstream in SMC |
Downstream in Goulburn R. |
|
Noorilim Estate | Within pump shed adjacent
| Upstream | Downstream | N/A |
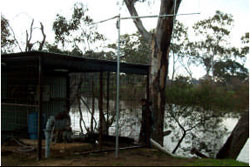
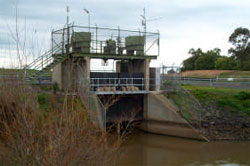
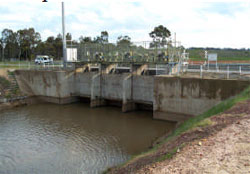
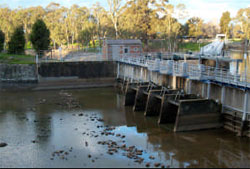
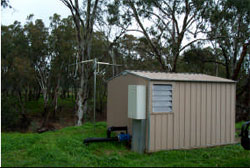
Design of the Educational Signs for Nagambie Lakes System Fish Radio Tracking Project.
Fish Movement Fish Movement in Nagambie Lakes and Lower Goulburn River
As part of a major study investigating native fish populations within the Nagambie Lakes and the lower Goulburn River, Murray cod and golden perch have been fitted with radio transmitters and released and are beingmonitored. Radio tracking these fish will provide information on habitat use andmovement within and outside the system.
The work is being funded with revenue from the Recreational Fishing Licence Trust Account and is being conducted by researchers from the Arthur Rylah Institute (see address details below). Researchers are working closelywith local angling clubs, watermanagers and other local and state organisations to provide information on themanagement of native fish within the Nagambie Lakes.
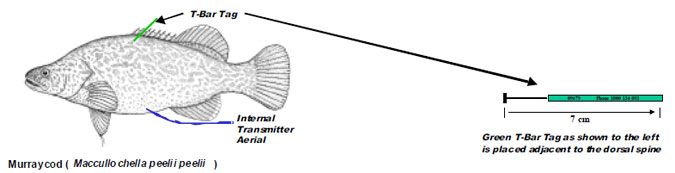
Murray cod are Australia's best known freshwater fish. Although still found throughout the MurrayDarling Basi n, numbers have decreased dramatically over the last 100 years. They have been found to live happily within large impoundment and can undertake large scale spawning migrations of manyhundreds of kilometres.
A reward is offered if you catch a T-Bar tagged fish and return it to the water.
All you need to do is phone in your name and contact phone number and the fish capture date, location, length and tag number on this toll free number: 1800 134 093.
You will receive a certificate detailing the release information of the fish, a drink holder and go in the draw for a cash prize.
The overall aims of this research in the Nagambie Lakes are to:
- determine likely success of future native fish stocking;
- determine habitat use of native fish;
- determine the movement patterns of native fish; and
- make recommendations to enhance fish numbers in the future.
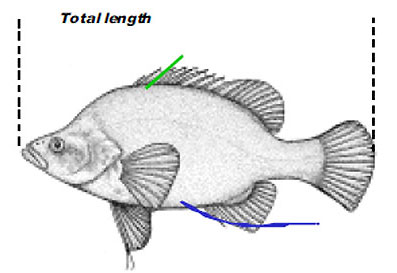
Golden Perch (Macquaria ambigua)
Fish drawings by Dave Crook © (Arthur Rylah Institute)
For further information contact the Freshwater Ecology Section, Department of Sustainability and Environment on (03) 9450 8600, PO Box 137, Heidelberg Vic, 3084.